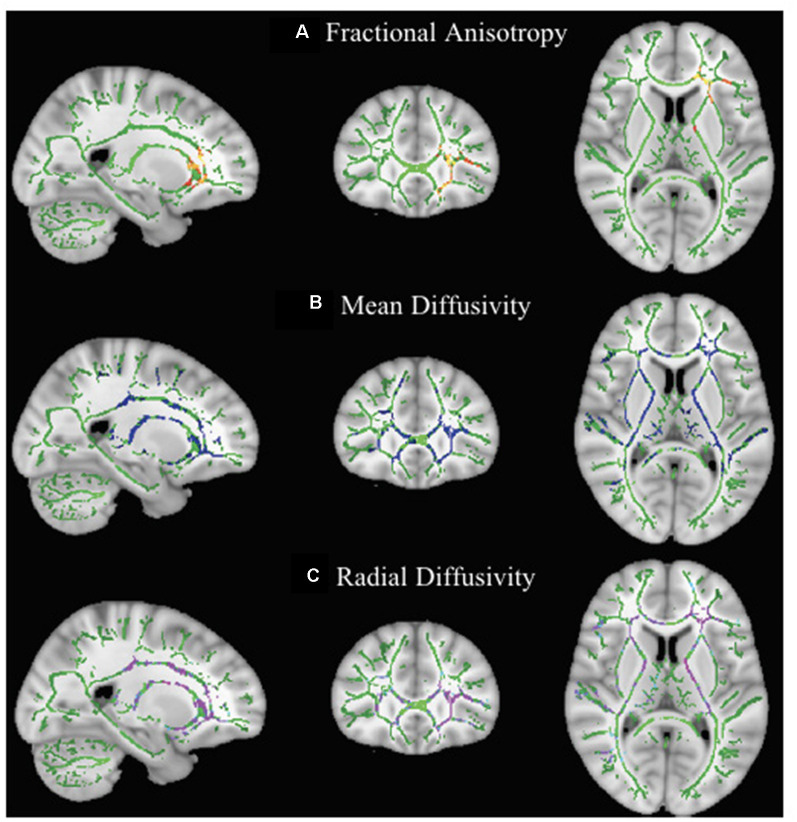
Figure 2.
Effect of maturation on DTI parameters in children with DCD. In these images, the white matter skeleton is shown in green and brain structures with altered fractional anisotropy (FA; A), mean diffusivity (MD; B), and radial diffusivity (RD; C) are shown in red, blue, and purple, respectively.

