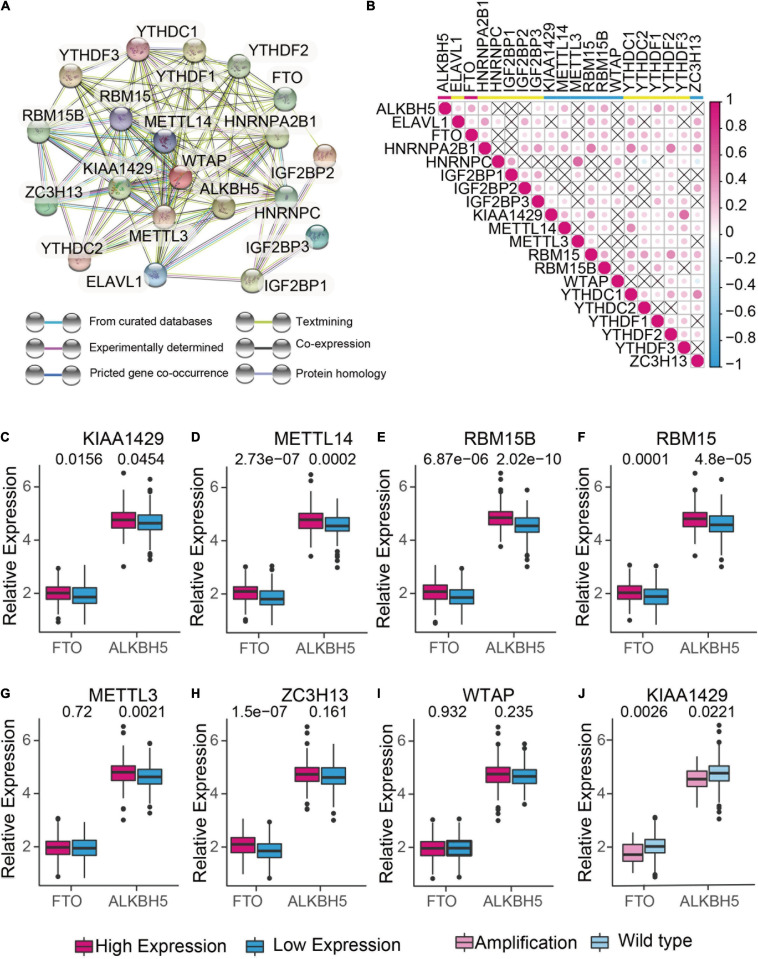
FIGURE 2.
The interaction and correlation analysis between m6A regulators in ovarian cancer. (A) Protein-Protein Interactions among the 20 m6A RNA methylation regulators using STRING 11.b. (B) Spearman correlation analysis of 20 m6A RNA methylation regulators in TCGA cohorts using R. (C-I) Correlation analysis between the expression of “erasers” (FTO and ALKBH5) and “writers” (KIAA1429, METTL14, RBM15, RBM15B, METTL3, ZC3H13, and WTAP). Median expression value was used to divide the patients into high and low expression groups. (J) Difference in the gene expression of “erasers” between KIAA1420-amplified and wild types.

