
FIGURE 3.
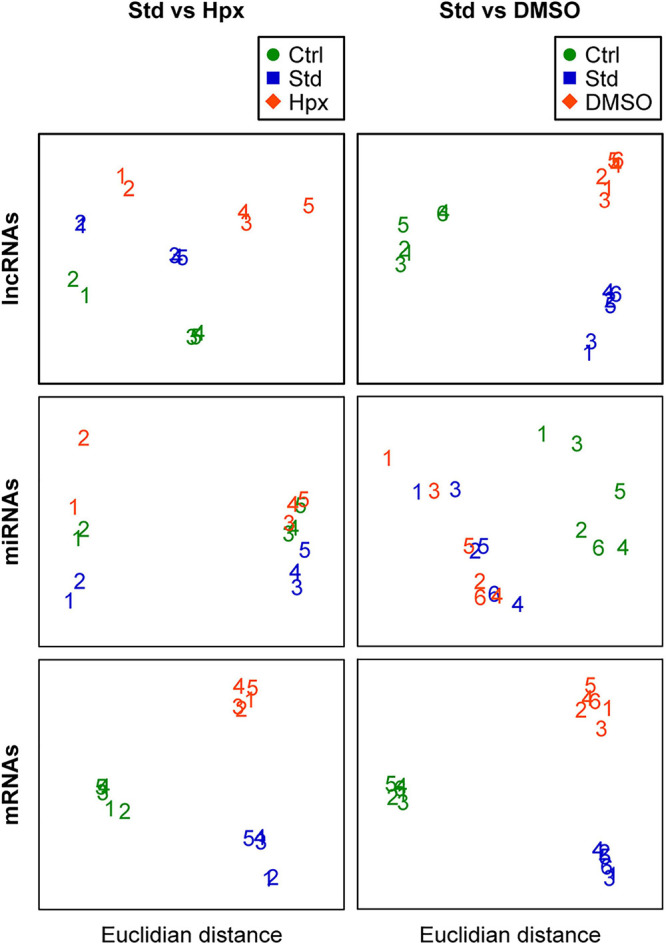
Multidimensional scaling plots of RNAs in the two experimental sets. Classic multidimensional scaling plots of lncRNAs, miRNAs, and mRNAs were created using Euclidean distance as dissimilarity matrix across the samples. The cells were sequenced after plating (Ctrl), 48 h after culture in standard condition (Std) or after culture in hypoxia (Hpx) or in medium with added DMSO. The numbers in the plots represent each placental ID in the two exposure sets.