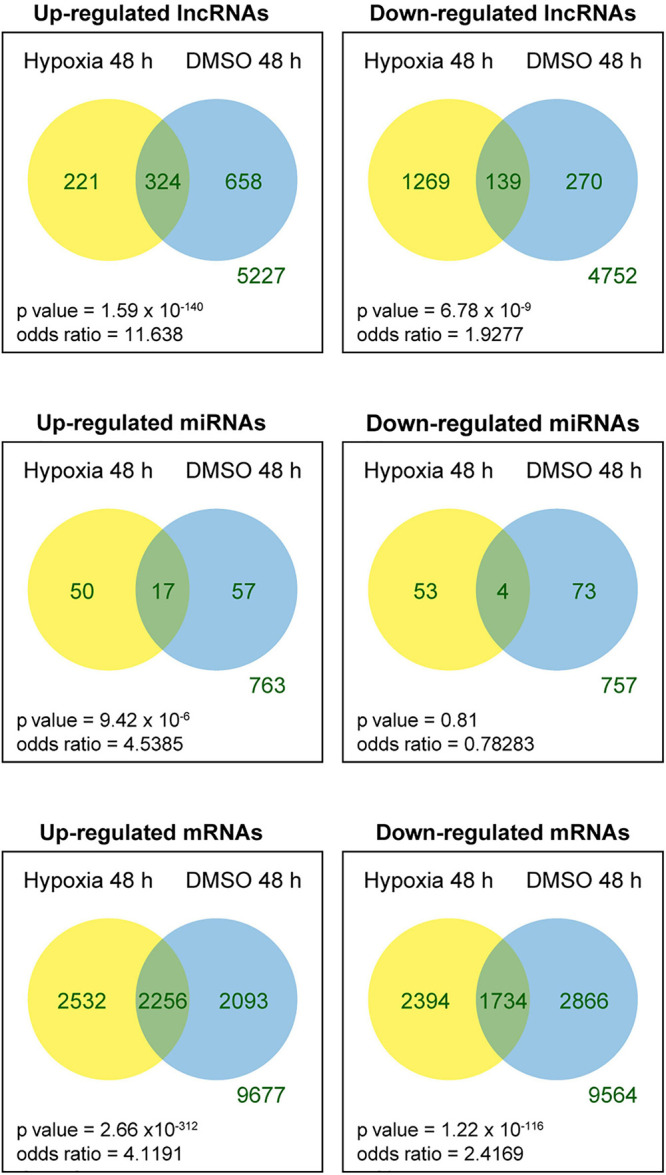
FIGURE 4.

Venn diagram of differentially expressed RNAs across the two experimental sets. Fisher exact tests were used to determine whether the genes that were up- or downregulated in one experimental set were more likely to be regulated in the same direction in the other experimental set.
