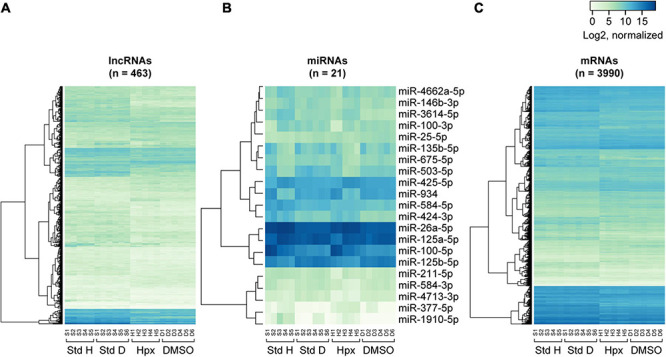
FIGURE 5.

Heatmaps of RNA expression clustering across the experimental paradigms. The heatmaps were constructed on the basis of normalized log2 gene expression for concordantly differentially expressed lncRNAs (A), miRNAs (B), and mRNAs (C) in the two exposure sets. Note that the first letter of the sample labels at the bottom of each plot represent experimental condition: “S” for 48 h in standard conditions, “H” for 48 h in hypoxic conditions, and “D” for 48 h in DMSO-containing medium. The number represents placental ID in each experiment. “Std H” and “Std D” refer to 48 h Std conditions in the hypoxia or DMSO experiments, respectively.
