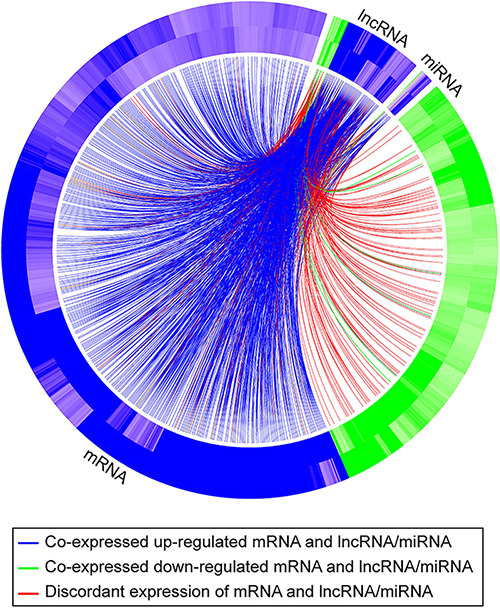
FIGURE 6.

A Circos plot depicting the association of mRNAs, lncRNAs, and miRNAs that exhibit a concordant expression change in the two exposures (hypoxia and DMSO). The outer band of the ring represents log2 fold changes in standard vs. hypoxia exposure, and the inner band of represents log2 fold changes in standard vs. DMSO exposure. Blue denotes that the RNA is upregulated; green denotes that the RNA is downregulated. The curved lines connect each lncRNA/miRNA to the co-expressed mRNAs, with blue (upregulation) and green (downregulation) lines representing positive correlations and red lines representing negative correlations.
