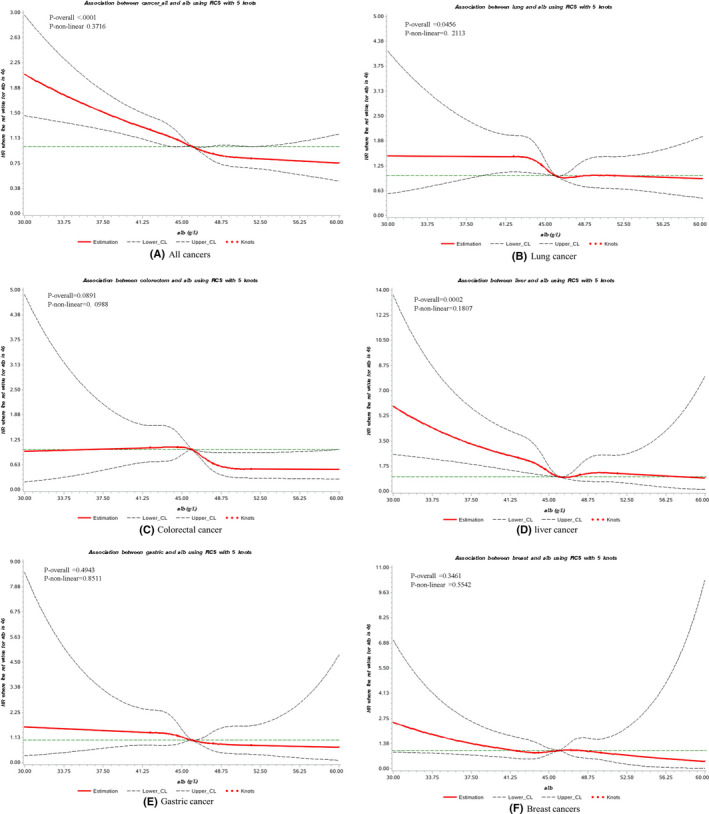
FIGURE 1.

Cubic spline graph of the adjusted HR (represented by solid line) and 95% CI (represented by the dotted lines) for the association between serum albumin and risk of primary cancer in Kailuan cohort, 2006–2013. (A) All cancers, (B) lung cancer, (C) colorectal cancer, (D) liver cancer, (E) gastric cancer, (F) breast cancer. Knots: 42, 44.6,46, 48 and 51.5 (95th) of the distribution of serum albumin concentration (g/L); Reference: 46 g/L, 50th of the distribution of serum albumin concentration. Analyses are adjusted for age 10−yearinterval, gender, education level (illiterate or primary school, junior high school, senior high school, and college and above), income status (<500 yuan per month, 500–1000 yuan per month, ≥1000 yuan per month), coal dust exposure status (non‐exposure, exposure), BMI (BMI <18.5, 18.5 ≤ BMI <25.0, 25.0 ≤ BMI <30.0, BMI ≥30.0), C‐reactive protein (<0.5, 0.5–1.0, 1.1–2.5, >2.5, mg/L), smoking status (never, quit, <1 cigarette per day, ≥1 cigarette per day), alcohol drinking status (never, ever) and HBV infection status (HBsAg negative, HBsAg positive). BMI, body mass index; HBV, hepatitis B virus
