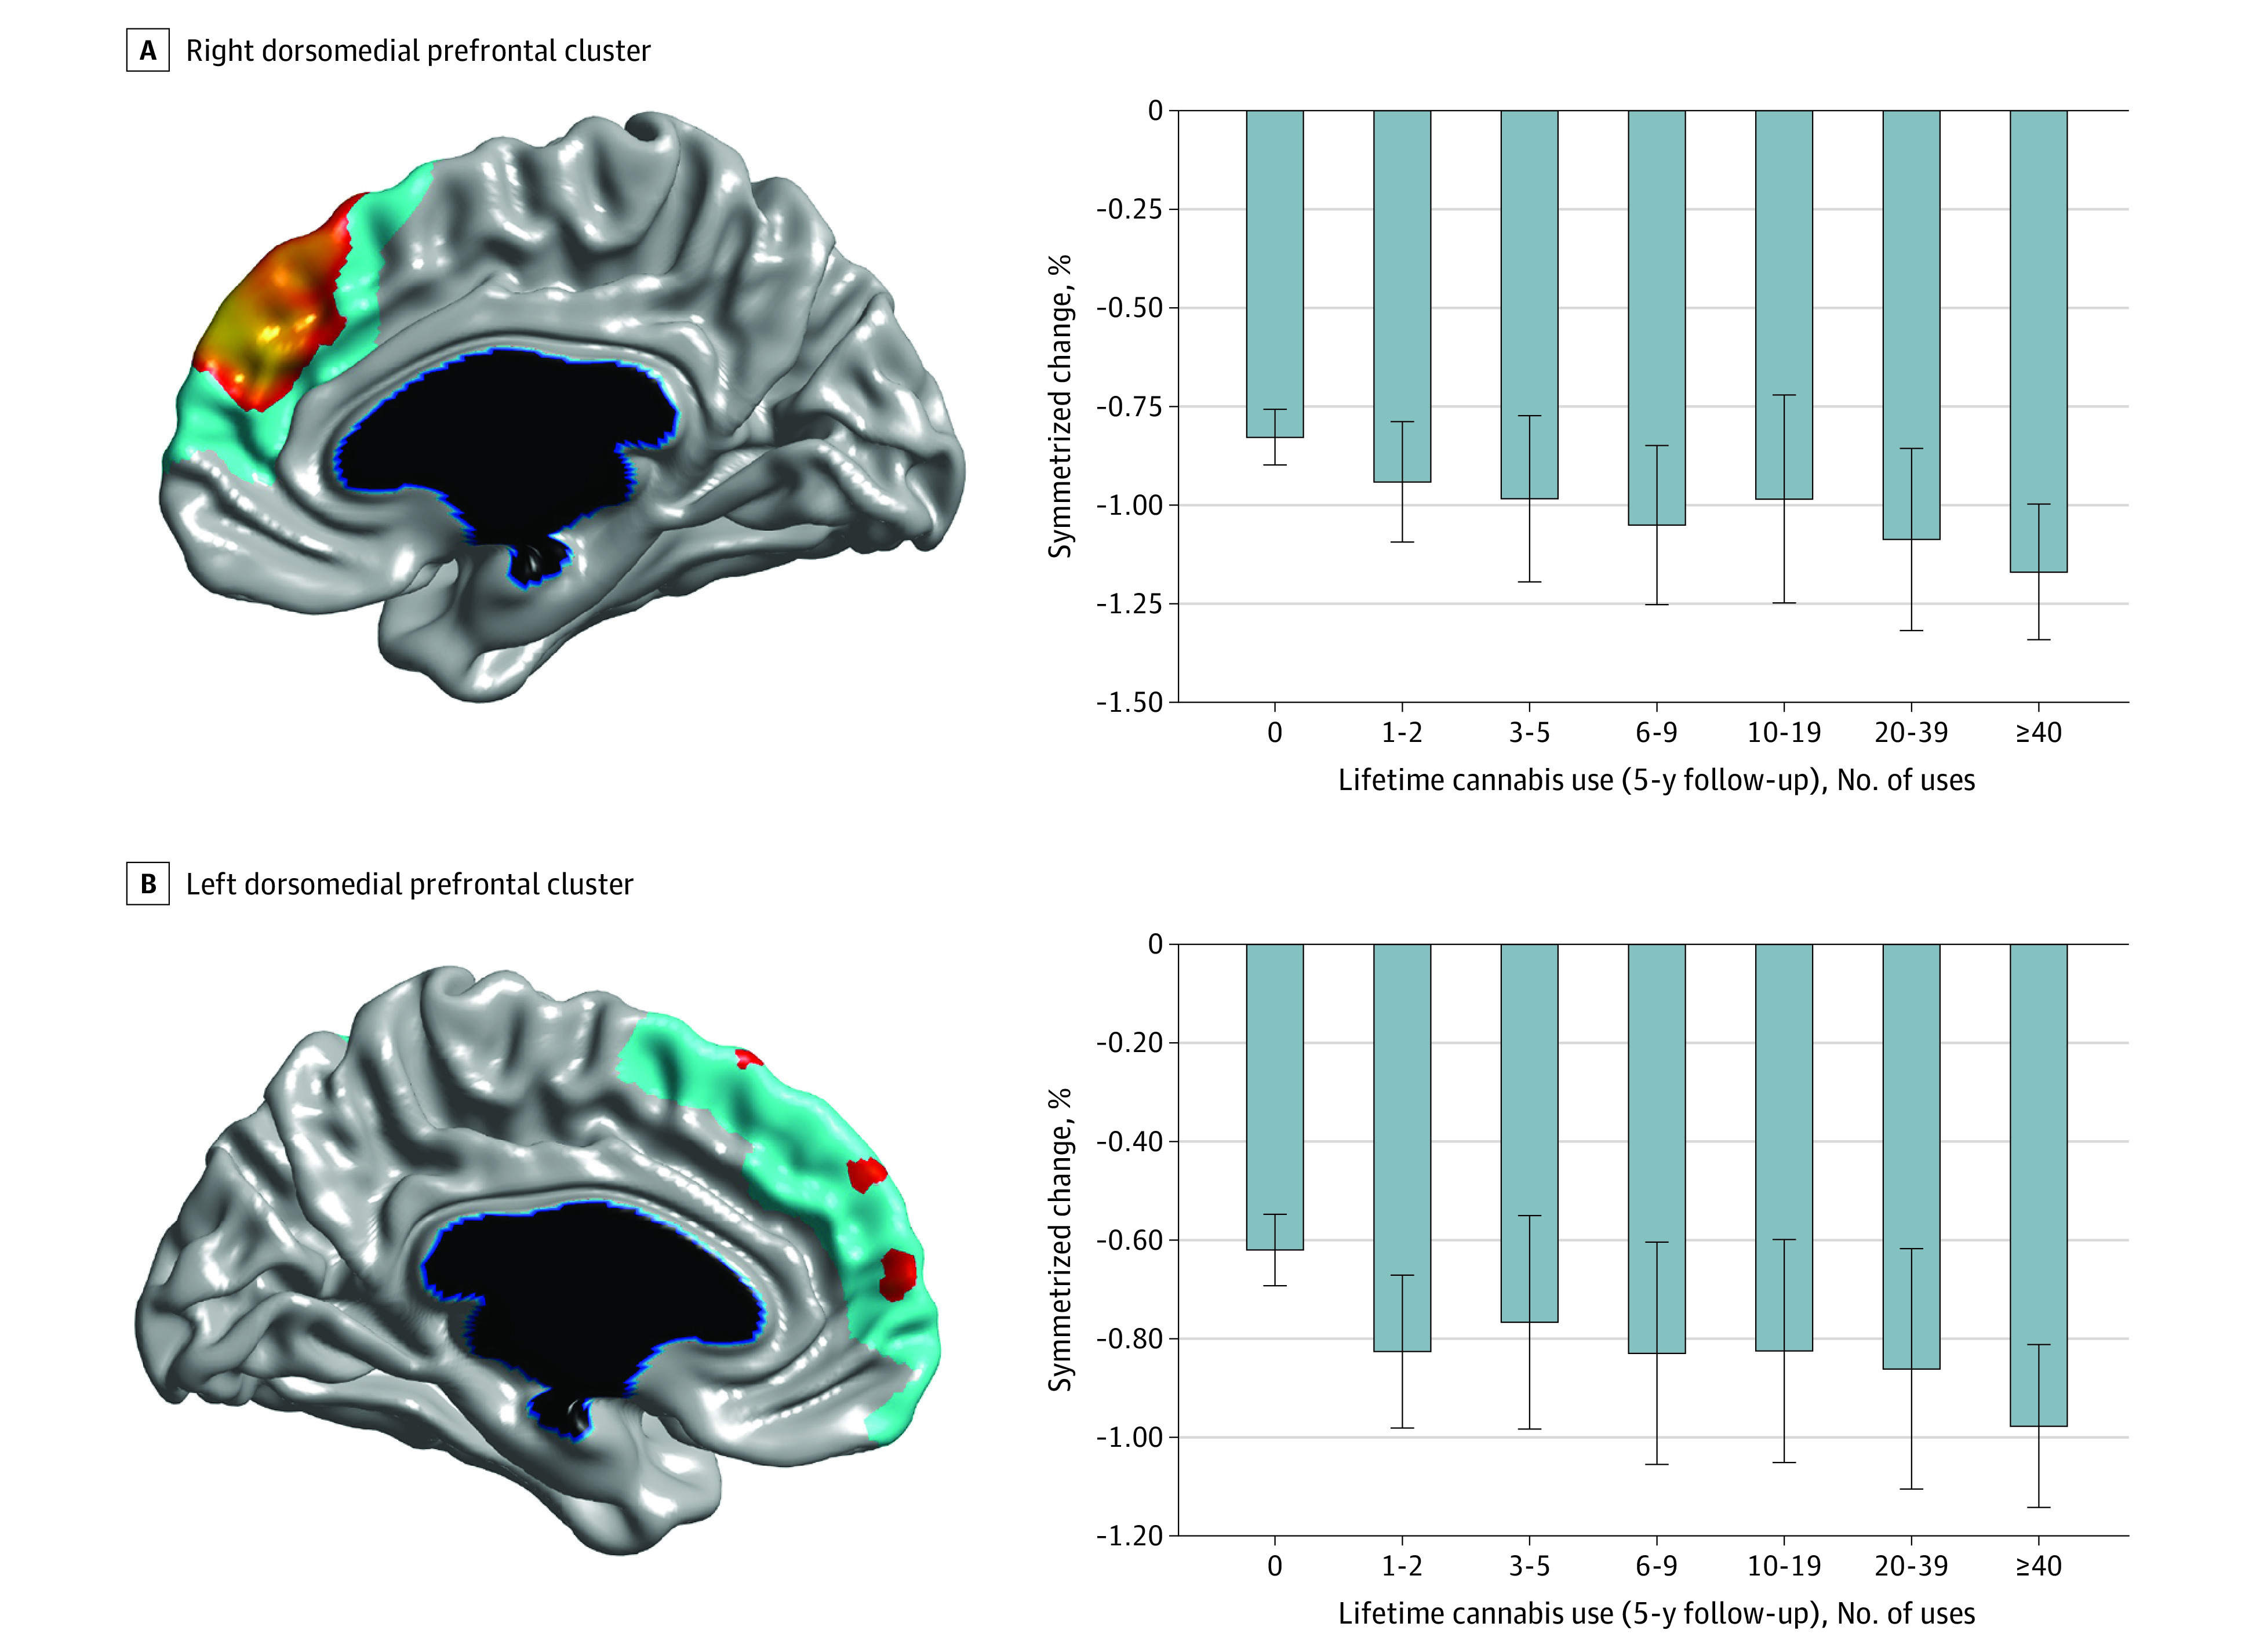
Figure 3. Magnetic Resonance Imaging–Assessed Cortical Thinning at Varying Levels of Lifetime Cannabis Use.

A, Right dorsomedial prefrontal cluster from linear mixed-effects analysis. B, Left dorsomedial prefrontal cluster from linear mixed-effects analysis. The bar graphs depict within-individual symmetrized percentage change (ie, change in cortical thickness, in millimeters per year, with respect to the mean cortical thickness across both time points) for each cluster at varying levels of lifetime cannabis use (at 5-year follow-up). Error bars represent 95% confidence intervals. Brain figures shown at P ≤ .05 with a whole-brain random field theory correction. Blue shades correspond to areas significant at the cluster level, and orange shades to areas significant at the vertex level.
