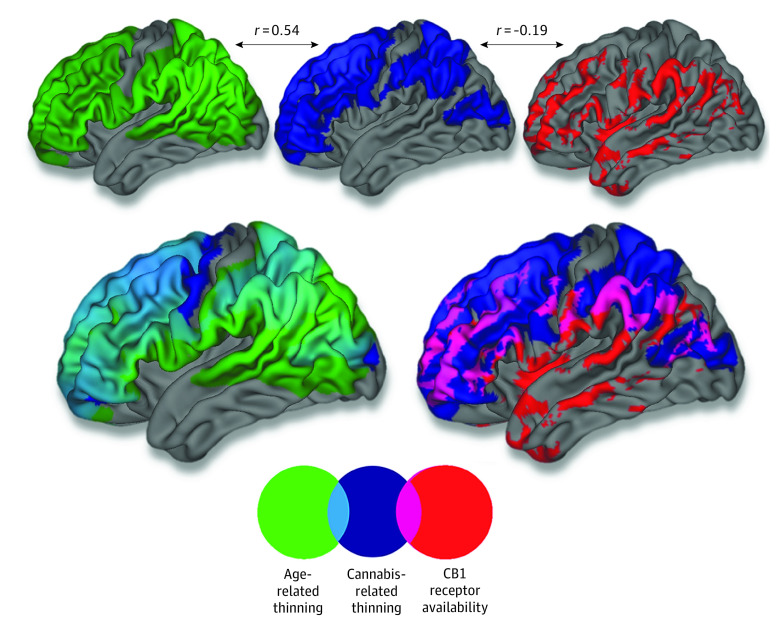
Figure 4. Topographical Overlap Between Age-Related Thinning, Cannabis Effect, and Cannabinoid 1 (CB1) Receptor Availability.
Topographical overlap between age-related cortical thinning in the sample (n = 799), areas in which age-related thinning was qualified by cannabis use, and positron emission tomography–assessed CB1 receptor availability (collected from a separate sample of 21 healthy adults). The r values correspond to Pearson correlation coefficients between unthresholded vertex-level surface maps. Please note that thresholds have been lowered for visualization purposes. Regional [11C]OMAR volume distribution is shown at >1.4, age-related thinning map is shown at t < −15, and cannabis-related thinning map is shown at t < −2.

