
FIGURE 2.
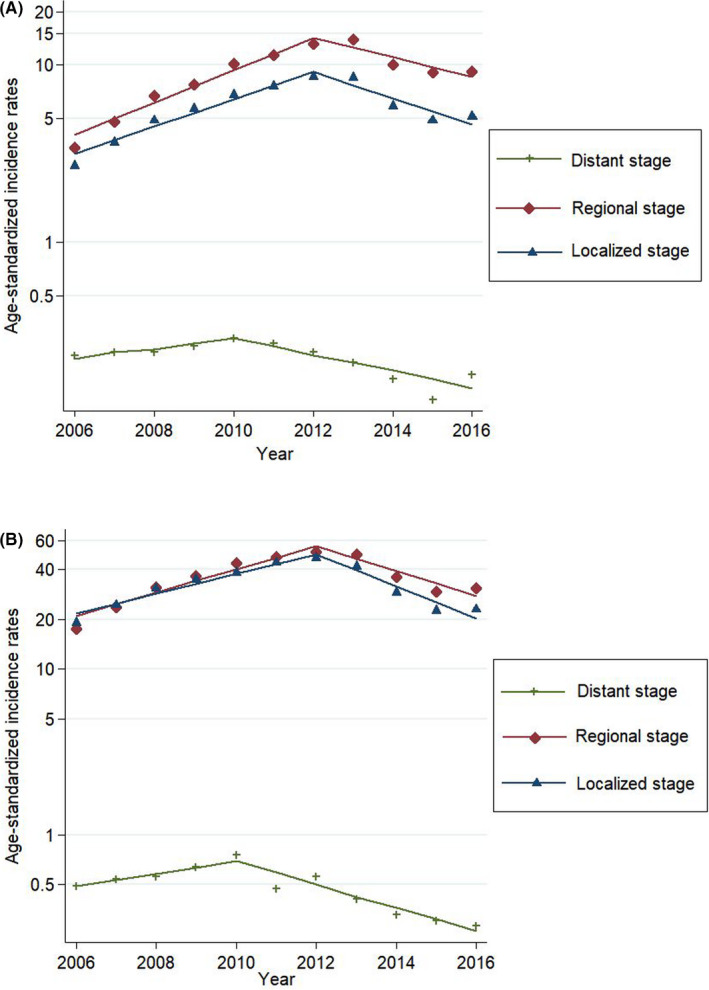
(A) Joinpoint regression analysis for thyroid cancer incidence rates of thyroid cancer by SEER summary stage in men. Footnotes: The age‐standardized rates are presented as incidence cases per 100,000 people using Segi's world standard population as standard population. Joinpoint regression analysis was used to determine whether there were significant changes in trends. The lines represent the estimated trends from the joinpoint regression, and the dots represent the observed (real) rates. (B) Joinpoint regression analysis for thyroid cancer incidence rates of thyroid cancer by SEER summary stage in women. Footnotes: The age‐standardized rates are presented as incidence cases per 100,000 people using Segi's world standard population as standard population. Joinpoint regression analysis was used to determine whether there were significant changes in trends. The lines represent the estimated trends from the joinpoint regression, and the dots represent the observed (real) rates