
Fig. 2. Effect of mTOR inhibition on plaque macrophage transcriptome.
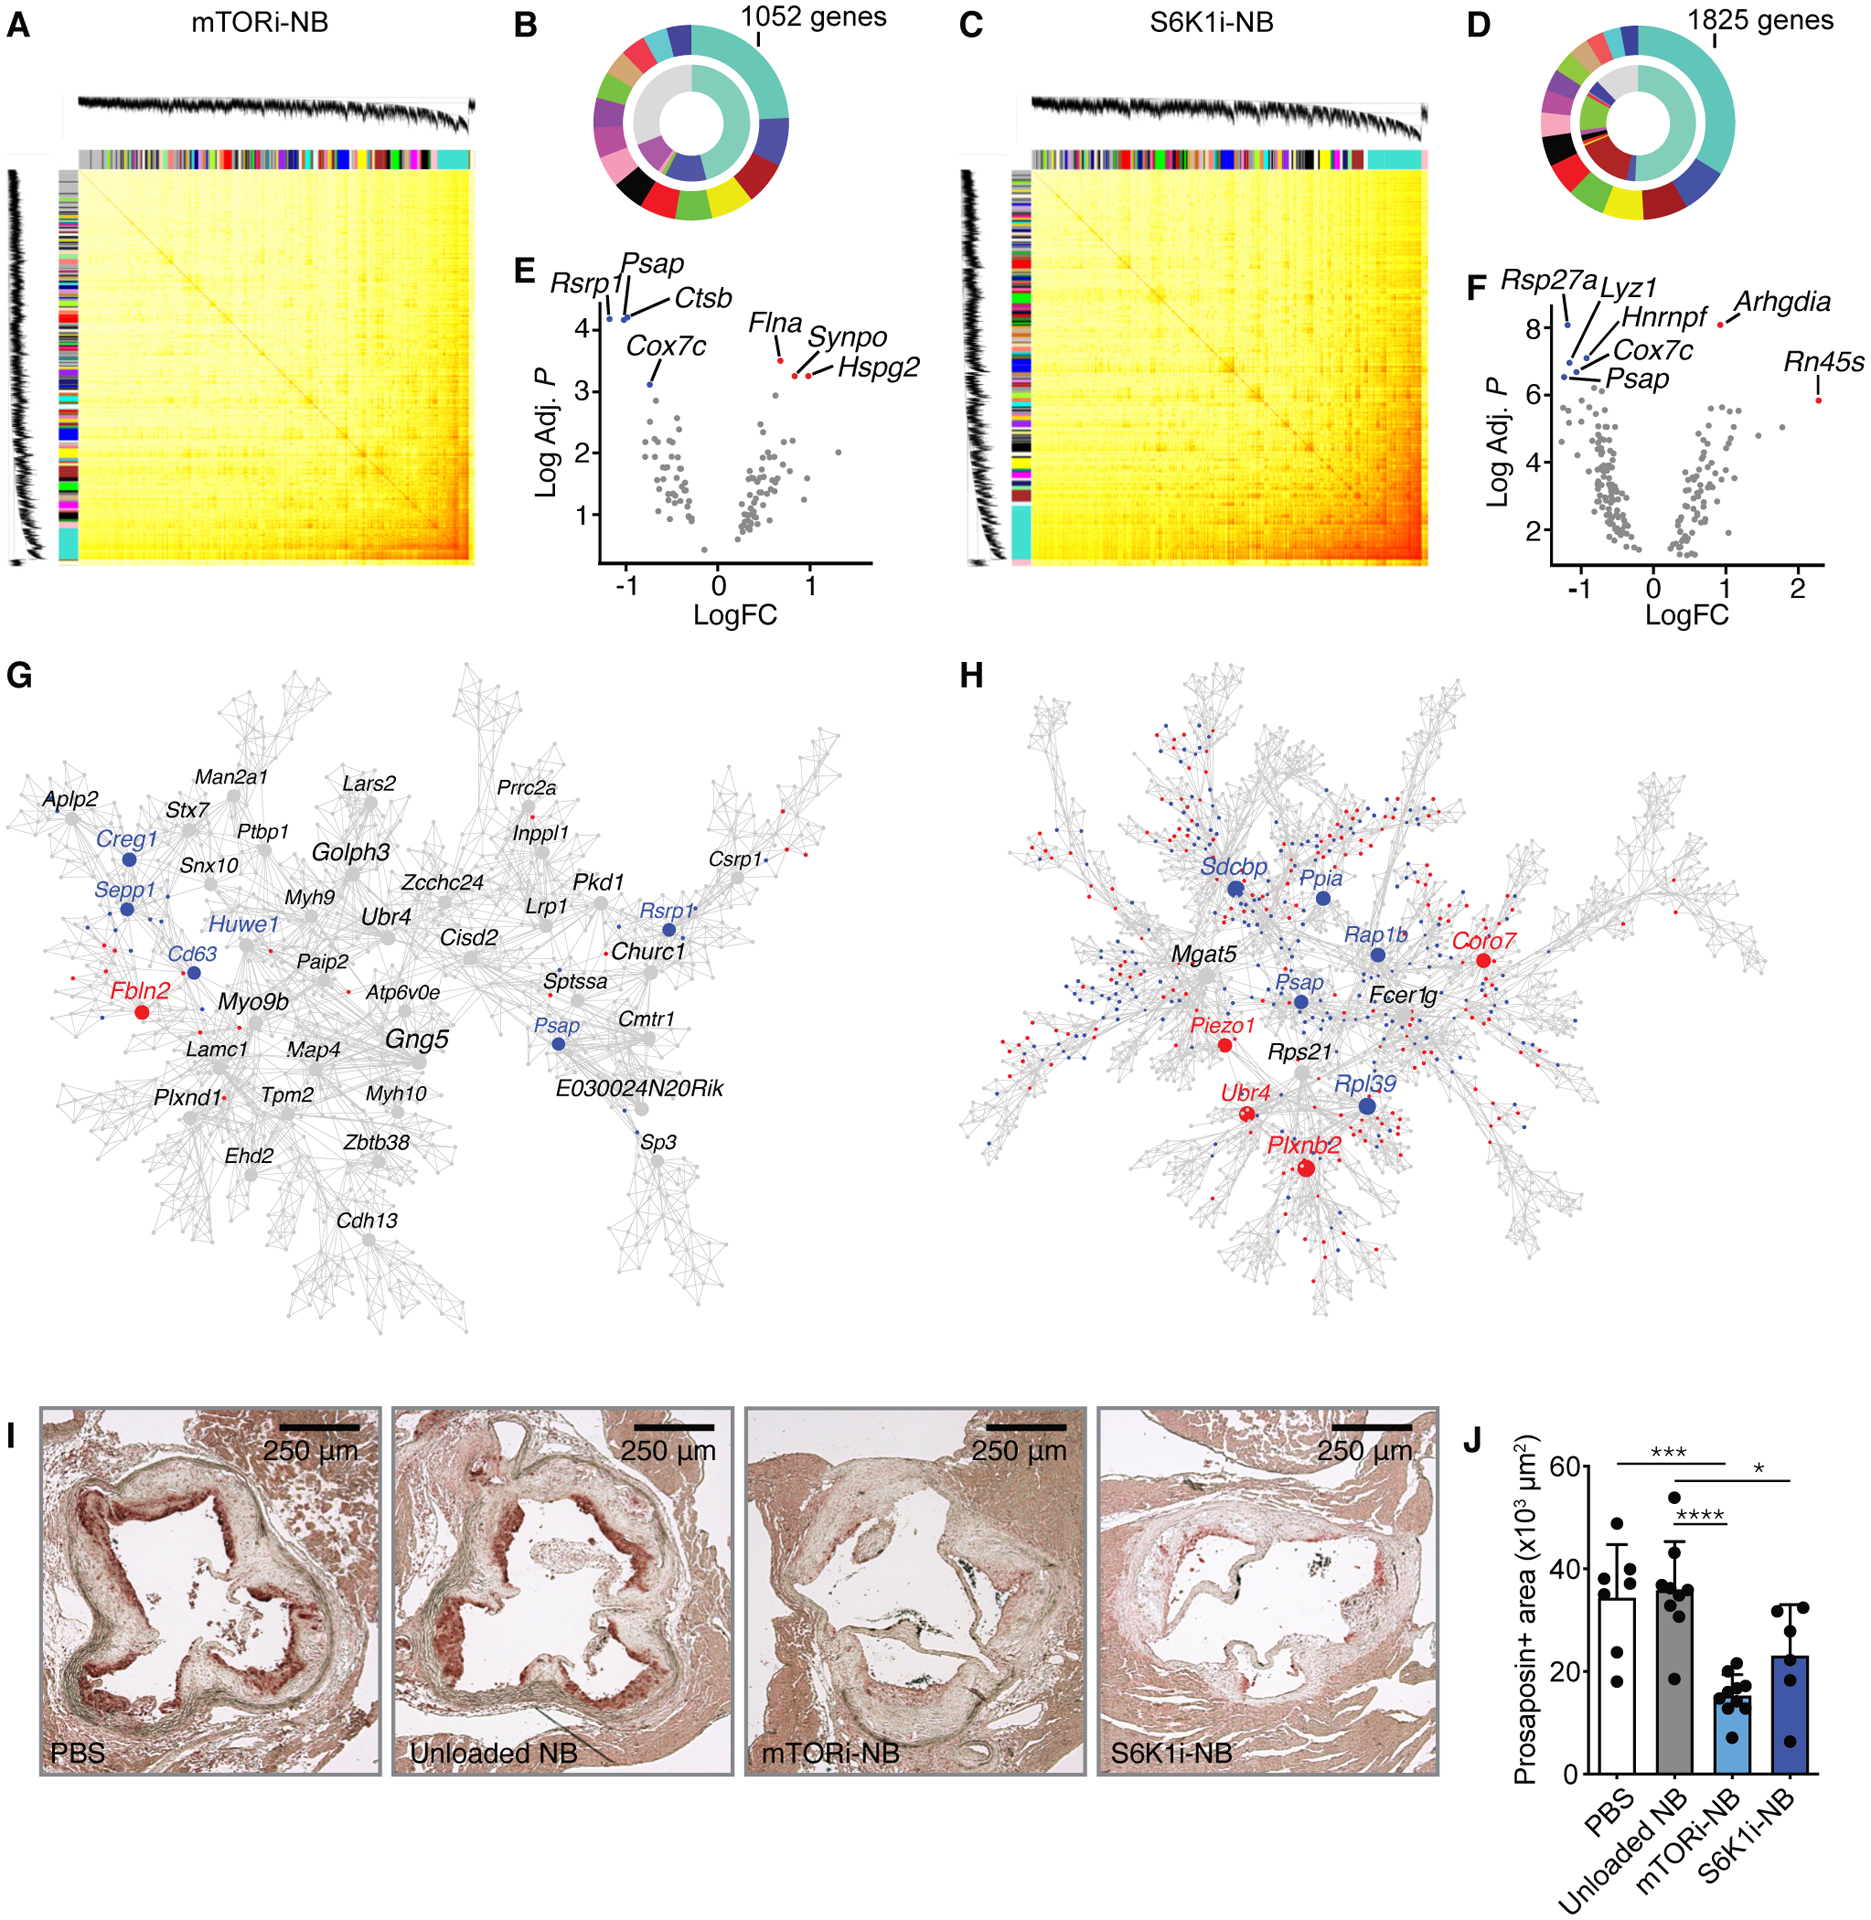
Transcriptome analysis was performed on CD68+ cells isolated from aortic roots of Apoe−/− mice after mTORi-NB (A,B,E,G) or S6K1i-NB (C,D,F,H) treatment, as compared to PBS. (n = 8–10 mice/group). (A,C) Topological overlap matrix. Each row and column of the heatmap represent a single gene, with the color intensity indicating the network connection strength. The dendrograms on the upper and left sides show the hierarchical clustering tree of genes. (B,D) The fifteen modules with the highest connectivity are ordered by size (outer ring). The inner ring shows differentially expressed genes within a module, as a percentage of total number of differentially expressed genes. (E,F) Volcano plot of genes within the turquoise module with the highest connectivity. Hub gene are identified based on p-value and fold change. The up- and downregulated hub genes are shown in red and blue, respectively. (G,H) Multiscale embedded gene co-expression network analysis (MEGENA) of the turquoise module. Up- and downregulated genes are shown in red and blue, respectively. (I,J) Apoe−/− mice were fed a Western diet for 12 weeks, followed by 1 week of treatment, while kept on a Western diet. Treatment consisted of 4 intravenous injections of PBS, mTORi-NB (rapamycin at 5 mg/kg), S6K1i-NB (PF-4708671 at 5 mg/kg) or unloaded nanobiologics (NB, at a comparable dose). Aortic roots were harvested for histological analysis. (I) Representative images of prosaposin staining of the aortic root and (J) quantification of prosaposin-positive areas within the plaque (n = 6–10 mice/group). Experiments were performed once. Data are presented as mean ± SD, non-parametric Mann-Whitney U test was used in J. *P < 0.05, ***P < 0.001, ****P < 0.0001.