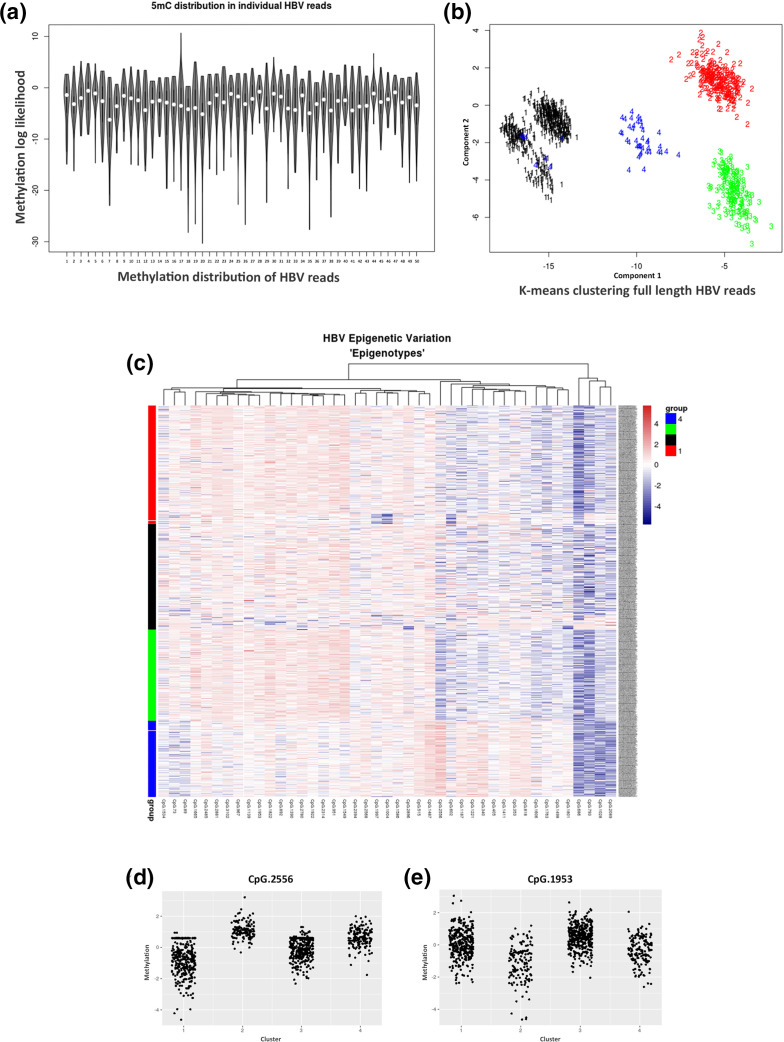
Fig. 3.
Epigenetic heterogeneity in HBV from infected patients. (a) Variability of 5mC levels in a random selection of single HBV molecules. (b) K-means clustering of HBV molecules. (c) Heatmap clustering of single HBV molecules. (d, e) Methylation distribution observed at CpG sites 1953 and 2556 in each cluster or ‘epigenotype’. Cluster numbers correspond to the same groups in Fig. 2b, c.

