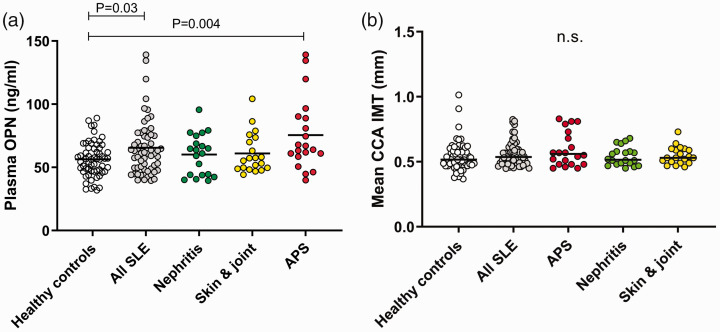
Figure 1.
(a) Plasma osteopontin (OPN) concentrations in healthy controls (n = 60) and the entire group of SLE patients (n = 60), as well as for the three SLE phenotypes of which each include 20 individuals. (b) CCA IMT of healthy controls (n = 60) and the entire group of SLE patients (n = 60), as well as for the three SLE phenotypes of which each include 20 individuals.
n.s. = not significant.

