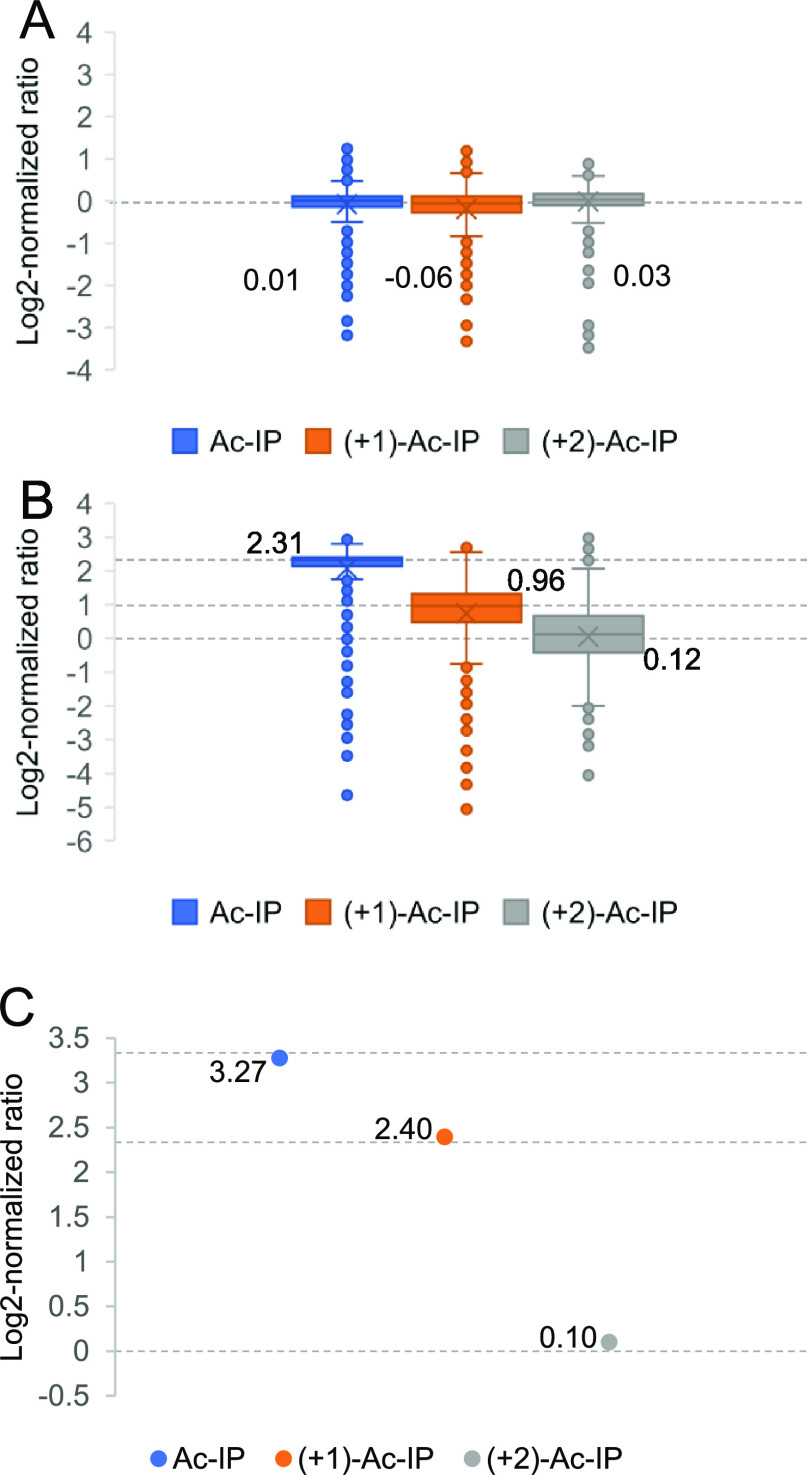
Figure 4.
Analysis of Ac-IP-tagged LysC yeast samples and BSA-yeast mixed samples. (A) Box plots showing the distribution of measured protein ratios in the log 2 transformation of triplex-labeled LysC yeast samples mixed at 1:1:1; (B, C) quantification results of a mixed BSA (10:5:1)-yeast (5:2:1) proteomics sample, in which triplex-labeled BSA peptides prepared from LysC digestion were mixed at 10:5:1 and yeast peptides prepared from LysC digestion were mixed at 5:2:1. (B, C) Box plots showing the distribution of measured protein ratios in the log 2 transformation of triplex-labeled LysC yeast samples and triplex-labeled BSA, respectively. The dotted lines represent the expected values of log 2-normalized ratios.

