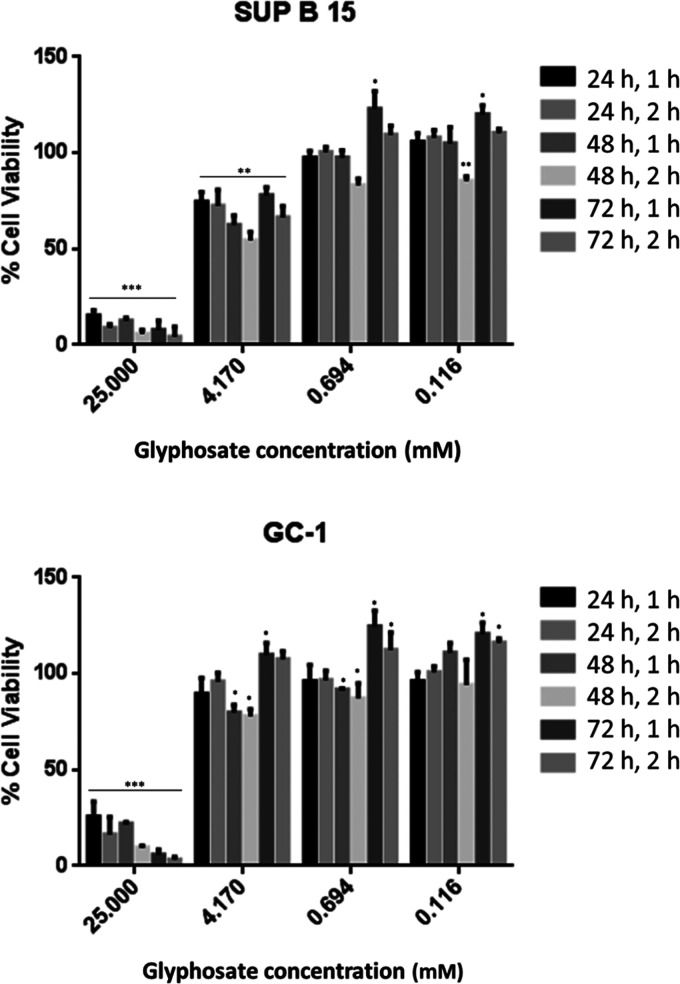
Figure 4.
Vitality graphs determined by lactate dehydrogenase assay using SUP-B15 and GC-1 cell lines. p-values = 0 < (***) < 0.001 < (**) < 0.01 < (*) < 0.05. The controls were set as 100% vitality. For the proliferation assays, only the results compared to the controls are shown (100% proliferation). These results clearly indicate the cytostatic effect of glyphosate, which is attributed to eEF1α1 inhibition.

