Abstract
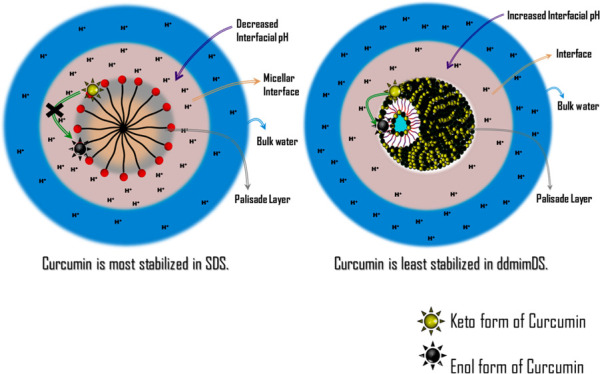
The chemical kinetic (CK) method, which involves the reduction of 4-hexadecylbenzenediazonium ions (16-ArN2+) by antioxidants (in the present case, TBHQ) occurring exclusively at the interface of the association colloids, was employed to establish the changes in the chemical reactivity of anionic surface-active ionic liquids (SAILs) as a function of the concentration and the composition in their mixed states. We used sodium dodecyl sulfate and different SAILs based on the dodecylsulfate surfactant containing 1-alkyl-3-methylimidazolium cations as counterions having a varying alkyl chain length of 4 (bmim), 8 (omim), and 12 (ddmim) carbon atoms. The structural transitions of aggregates of the SAILs from the micellar to vesicular form were observed as a function of concentration in single surfactant systems and as a function of composition in mixed surfactant systems. Results of the reduction kinetics of 16-ArN2+ at the interface of such aggregates, which depends on the acid/base equilibria at the interface, gave an insight into the changes in the interfacial H+ ions with the change in the hydrophobicity of the counterions of SAILs and the morphological changes from micelles to vesicles as a function of concentration or composition. These changes in the interfacial pH correlate very well with the stability of curcumin within these self-assemblies, which exclusively depends on the pH of the medium and highlights the importance of the results obtained from the CK method in selecting the appropriate medium/conditions for the stabilization of the bioactive molecules.
Introduction
The association colloids formed as a result of self-assembly of amphiphiles are the dynamic structures having morphologies mainly determined by the delicate balance-of-forces involving various noncovalent interactions like hydrophobic interactions, electrostatic interactions, hydrogen bonding, and so forth. The micelle/water interface, which demarcates the bulk phase from the colloidal phase, acts as a conceptual boundary between the two phases and represents a loose porous boundary allowing the diffusion of specific ions with specific properties based on the hydrophobic–hydrophilic balance. The composition of such an interface like amount of water, counterions, co-ions, ion pairs, and so forth in the interfacial region mainly contributes to the delicate balance-of-forces operating in the association colloids, which in turn can be tuned to control the morphologies of these nanostructures. Therefore, studying the interface is of utmost importance having relevance to the cell membranes, solubility and stability of the biomolecules, channeling of the ions in the living cells, protein folding/unfolding in membranes, chemical reactivity in the micellar systems, and understanding morphological changes in the micellar systems.
One significant barrier probing the properties and compositions of the interfacial regions of association colloids in detail is the absence of many methods for determining interfacial molarities of ions, molecules, and water and the absence of methods for carrying out the reactions exclusively within the interfacial regions. In the last 3 decades, Romsted et al.1−4 developed two different experimental methods based on the unique chemistries of two different arenediazonium ion probes, viz., the chemical kinetic (CK) and chemical trapping (CT) methods to study the chemical reactivity and composition of the micelle/emulsion––water interface. The CK method provides values for the rate constants of the reaction of phenolic antioxidants like t-butylhydroquinone, TBHQ with 4-hexadecylbenzenediazonium ion, 16-ArN2+, exclusively in the interfacial regions of the micelles helping us to know the chemical reactivity of the interface under a given set of conditions. Besides, because the rate of reaction between TBHQ and 16-ArN2+ depends significantly on the pH of the medium, the results of the reduction kinetics of 16-ArN2+ at the interface of the micellar aggregates give an insight into the changes in the interfacial H+ ions. The CT method, which uses a structurally similar probe, 4-hexadecyl-2,6-dimethylbenzenediazoniumion, 16-2,6-ArN2+, is used to determine the interfacial molarities of water, anions, and other weakly basic nucleophiles in the interfacial region of the micelles.
The CK method has been applied to analyze the chemical reactivity at the interface of the association colloids, which is quite different from that in the bulk solution. In one report, Gao et al.5 have applied this method to analyze the effect of specific salts on the chemical reduction of the arenediazoium ion by t-butylhydroquinone in the emulsions of the zwitterionic sulfobetaine surfactant. The results obtained can be used to tune the rates of acid–sensitive reactions in association colloids including micelles, vesicles, microemulsions, and opaque emulsions, which can be useful in phase-transfer catalysis or for promoting reactions between water-insoluble organic substrates that are catalyzed by acid or base or react with nucleophiles. In various other studies by Romsted et al.,6−9 the CK method has been successfully applied to determine the antioxidant distribution and interfacial rate constants in the opaque ionic emulsions. Recently, Dar et al.10 have employed the combination of CK and CT methods to discuss the chemical reactivity of 16-ArN2+ with TBHQ in the mixed micelles of CTAB/C12E6 in detail, yielding a significant amount of quantitative information about the relationships between the chemical reactivity and interfacial compositions of the mixed micelles.
In this report, we have applied the CK method to analyze the effect of surfactant concentration of various anionic surfactants, viz., sodium dodecyl sulfate (SDS), 1-butyl-3-methylimidazolium dodecyl sulfate (bmimDS), 1-octyl methylimidazolium dodecyl sulfate (omimDS), and 1-dodecyl-3-methylimidazolium dodecyl sulfate (ddmimDS) on the chemical reactivity of reduction of 16-ArN2+ with TBHQ occurring at the micellar interface. These surfactants have the same dodecyl sulfate anionic part with similar imidazolium-based counterions having different alkyl chain lengths and hence different hydrophobicities. Such surfactants, viz., bmimDS, omimDS, and ddmimDS are known as surface active ionic liquids (SAILs) that offer uniqueness in being environmentally benign, display superior surface activity, and are flexible toward modulating their morphologies.11 In recent years, extensive research has been carried out to understand the aggregation behavior and properties of SAILs in the aqueous phase.12 Due to the existent synergistic interactions13,14 in their mixed form, they have gained considerable interest and importance for obtaining the fundamental knowledge of the specific interactions governing their properties, so that the utility of such environment-friendly surfactants can be enhanced to a significant extent. It is worth noting here is that the interfacial dynamics of the SAIL self-assembled structures has not been reported so far in the literature, though the mixed micellization process of SAILs including their phase behavior, size and shape, and solubilization has been investigated to some extent.15,16 In this context, we also report the effect of change in composition at the micelle–water interface in bmimDS/omimDS and bmimDS/ddmimDS mixed micelles by varying their mole fractions on the chemical reactivity of reduction of 16-ArN2+ with TBHQ. It is interesting to note that the single surfactants omimDS and ddmimDS at higher surfactant concentration and mixed surfactants of bmimDS with omimDS or ddmimDS above certain composition at 10 mM total surfactant concentration were observed to undergo the micelle-to-vesicle transitions, allowing us to study the effect of morphological changes on the chemical reactivity. The insights into the interfacial dynamics of such micellar systems not only have the potential to make them the better and alternate choices to the conventional surfactant systems but also establish the structure–reactivity relationship vis-à-vis the changes in the chemical composition of such an interface. To the best of our knowledge, this is the first report wherein the CK method has been applied to interpret the chemical reactivity and give insights into the changes in the interfacial pH at the interface of SAILs and their mixtures as a function of surfactant concentration and the composition of the mixture. Specifically, these changes in the interfacial pH inferred from the CK method had an excellent correlation with the stability of curcumin within these self-assemblies, which strongly depends on the pH of the medium and highlights the importance of the results obtained from the CK method in selecting the appropriate medium/conditions for stabilization of the bioactive molecules.
Results and Discussion
Micellization and Micellar Morphology of SDS, bmimDS, omimDS, and ddmimDS Anionic Surfactants
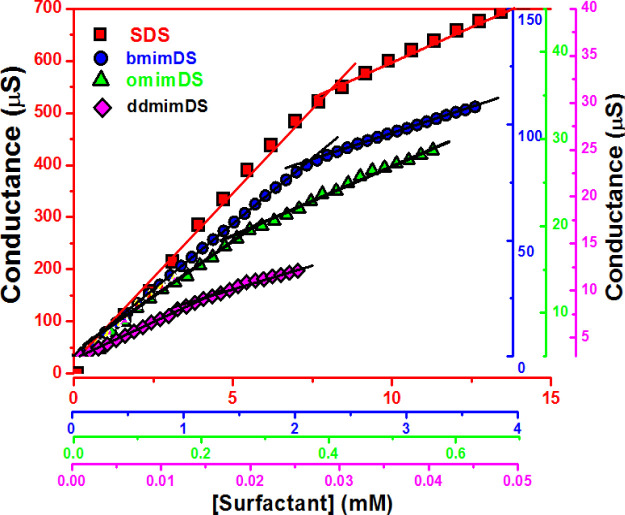
Figure 1 shows the specific conductance versus concentration plots of SDS and different SAILs in aqueous solution at 25 °C. Conductivity increases from fast to slow and turns an inflection point with the increase in surfactant concentration. The inflection point represents cmc, and the slopes of two distinguishing linear regimes are used to calculate the degree of counterion dissociation (α) as the ratio of the slope in the higher concentration regime above the inflection point to one in the lower concentration regime. The degree of counterion binding (β) can be obtained from α using the relationship: β = 1 – α. The β value is an important parameter because it represents a fraction of the counterions that are associated with the Stern layer to counterbalance the electrostatic repulsions among headgroups that oppose micelle formation. The conductivity increases quickly with concentration below the cmc due to the increase in the number of free ions in the solution. However, above cmc, micelles are formed and due to their slow mobility, they contribute to conductivity to a lesser extent. Also, a fraction of counterions bound to the micellar surface reduces the number of current carriers, allowing for a slow increase in the conductance with the addition of the surfactant.
Figure 1.
Variation of conductance (μS) as a function of the concentration of SDS, bmimDS, omimDS, and ddmimDS at 25 °C. The matching colors of the data points and the axis of the plot represent different surfactants, as shown in the legend.
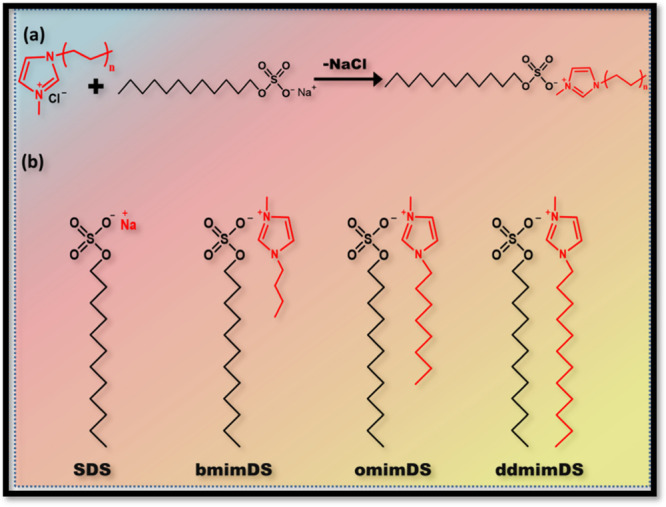
The cmc values determined from conductivity measurements for SDS, bmimDS, omimDS, and ddmimDS at 25 °C were 8, 2.2, 0.25, and 0.016 mM, respectively, with the corresponding β values of 0.68, 0.64, 0.57, and 0.34. The trend followed in cmc values is SDS > bmimDS > omimDS > ddmimDS, which is the same as that of the trend observed in the degree of counterion binding. As can be seen in Scheme 3, the counterion of the surfactant anion dodecyl sulfate (DS–) changes from the simple inorganic ion (Na+) to hydrophobic ionic liquid-based organic counterions, viz., bmim+ (with 4 carbon alkyl chains), omim+ (with 8 carbon alkyl chains), and ddmim+ (with 12 carbon alkyl chains). These imidazolium-based organic counterions have been reported17,18 to lower down the cmc of the dodecyl sulfate surfactant because such counterions penetrate their alkyl chains into the micelles due to hydrophobic interaction and reduce the repulsion between the negatively charged sulfate headgroups of SDS due to their electrostatic attraction with the imidazolium cation of the counterion. Such strong hydrophobic and electrostatic interactions reduce the cmc of imidazolium-based dodecyl sulfate surfactants relative to SDS due to the formation of a type of mixed micelles. As the incorporation tendency of these imidazolium counterions into the dodecyl sulfate micelles increases as a function of their hydrophobic chain length, the tendency to lower the cmc system follows the order ddmimDS > omimDS > bmimDS. Much higher tendency of ddmim+ and omim+ counterions to get incorporated into micelles has been found to have an effect of inducing the morphological changes in the SDS aggregates to rod-shaped micelles or vesicles.19 Interestingly, the degree of counterion binding follows the trend SDS > bmimDS > omimDS > ddmimDS. The degree of counterion binding of bmimDS (β = 0.64) is slightly lower than SDS (β = 0.68). This can be ascribed to the effect of counterion species, namely, smaller inorganic counterion (Na+) and larger cyclic organic counterions bmim+. The presence of steric hindrance of organic counterions would reduce the interaction between the counterion and hydrophilic headgroup, resulting in slightly fewer counterions existing at the micellar surface. In contrast to bmimDS, omimDS and ddmimDS have the counterions with alkyl chains (8 and 12) sufficiently long to tend to self-aggregate. For example [omim]Br and [ddmim]Br form the aggregates and have the cmc values of 150 and 11.0 mM, respectively, which would be even higher in the case of their chlorides.20 These cmc values are very much higher than SDS. It has been reported21 that the micellization of SDS is significantly altered by the addition of imidazolium-based ionic liquid (IL) salts like [bmim]Br and [hmim]Br (having 6 carbon alkyl chains) as additives. Their results show that the short-chained ILs chiefly act as simple electrolytes with a minor contribution of mixed micellization, whereas both the electrolyte effect and mixed micellization play important roles in the case of longer-chained ones, resulting in micellization at lower cmc. Moreover, a significant drop in the degree of counterion binding was observed relative to SDS with the addition of long-chained ILs. Because in the abovementioned example, the sodium ions act as counterions for SDS, the addition of imidazolium ILs with alkyl groups results in the insertion of the imidazolium cation in the micelles, forming the ion pairs with the negatively charged sulfate headgroup and compensating its charge. This results in a decrease of the counterion binding of sodium ions to the micellar interface and hence justifies the decrease in the counterion binding in such systems.
Scheme 3. (a) Depiction of the Reaction Scheme between ILs and SDS and (b) Structure of SDS and Different SAILs Used in the Study.
In the present case, we use bmimDS, omimDS, and ddmimDS surfactants, which do not have any sodium ions as counterions but the imidazolium-based ILs as counterions. Under such circumstances, the degree of counterion binding should have been in the order ddmimDS > omimDS > bmimDS due to the more tendency of longer alkyl chains to get inserted into the micelles, which is quite opposite to our experimental observation. Jiao et al.17 have shown that the degree of counterion binding for 1-butyl-3-methylimidazolium dodecyl sulfate (bmimDS) and N-butyl-N-methylpyrrolidinium dodecyl sulfate is much lower compared to SDS, as also indicated by our study. To rationalize this observation, we believe that the degree of counterion binding data calculated from the conductivity data has the involvement of the hydrogen ion concentration at the negatively charged micellar interface, as discussed below.
During the mixed micelle formation, the surfactant having lower cmc predominates the mole fraction of the micellar pseudophase. Therefore, in the case of omimDS and ddmimDS, the micelles would be predominated by the DS– surfactant ion, as the cmc values of [omim]Br and [ddmim]Br are 150 and 12.0 mM, respectively, which is quite higher than SDS (8.0 mM) itself. The insertion of the imidazolium-based counterion in the dodecylsulfate micelles would lead to the formation of ion pairs, decreasing the negative charge on the micellar surface and hence releasing the hydrogen ions from the micellar surface into the bulk. Because of the special ability of H+ ions to conduct electricity, its release to the bulk from the micellar interface would not allow the decrease in conductance of the surfactant solution above cmc to an appreciable extent as observed in the case of SDS, wherein ion pair formation is significantly less.22 Therefore, taking into consideration the ability of two ions to participate in the mixed micelle formation and having a higher propensity to get inserted into the micelles, their counterion binding would be higher than the more hydrophilic bmim+ counterions and they would have a significant effect of influencing the exchange of H+ ions at the micellar interface. It has been well documented that the largely hydrophobic counterions have a significant counterion binding effect.23 The ion exchange including the H+ ions in the micellar solutions has been demonstrated by Quina et al.24 Using the concept of this kind of ion exchange, the chemical reactivity at the interface of these surfactants can be easily justified as discussed in the next sections.
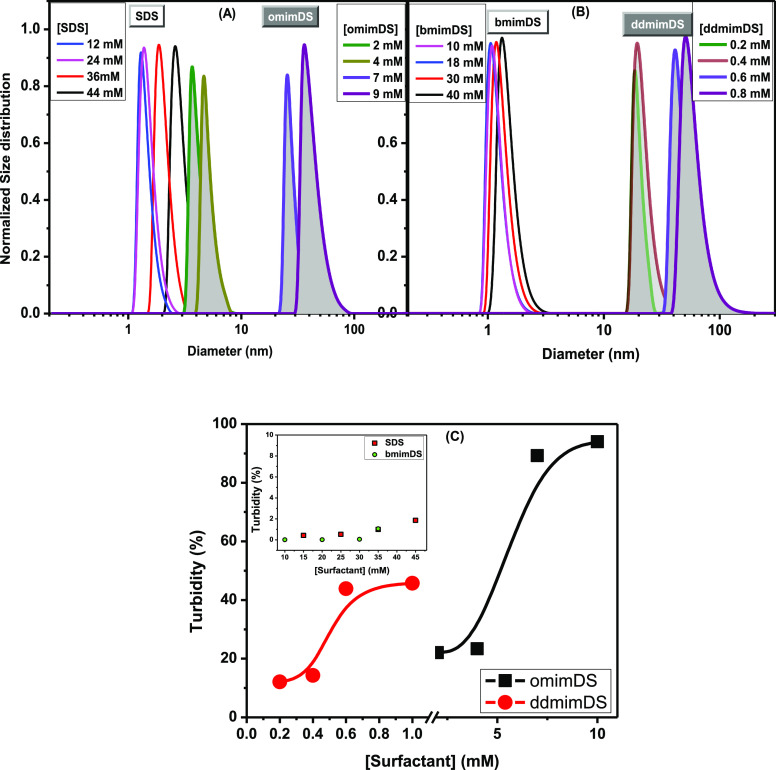
We performed dynamic light scattering (DLS) and turbidity measurements (Figure 2) of the surfactant solutions with the concentration above their cmc values for obtaining the information about the shape transition in the micelles of SDS and SAILs. As can be seen from the figure, there is neither any significant change in the size of SDS (Figure 2A) and bmimDS (Figure 2B) nor any increase in turbidity (inset of Figure 2C) with the concentration of surfactant. However, in the case of omimDS and ddmimDS, we observed an increase in the size of the micelles above 5 and 0.4 mM of surfactant concentration, respectively, with the concomitant increase in the turbidity of the solutions (Figure 2). In the case of omimDS, the aggregate size of about 4–5 nm (typical of spherical micelles) changed to about 40–50 nm at about 9 mM of concentration. In the case of ddmimDS, the aggregate size was around 12–15 nm (typical of rod-shaped micelles) near cmc, which abruptly changed up to 50–60 nm at 0.8 mM concentration. The aggregate structure in the range of 40–60 nm can be ascribed to the formation of the vesicles as reported in the case of SDS-SAIL mixtures.21,25
Figure 2.
(A,B) Variation of the size of the self-assemblies of SDS (open), omimDS (filled), bmimDS (open), and ddmimDS (filled) with the surfactant concentration above their cmc values and (C) variation of turbidity with the concentration of surfactants omimDS and ddmimDS; the inset shows the same for SDS and bmimDS at 25 °C.
It is well known that the spherical micelles are usually formed at low surfactant concentration, which can eventually change into rodlike micelles or vesicles depending on the surfactant.26 Catanionic surfactants or cationic–anionic surfactant mixtures have been usually found to transform into vesicles at higher surfactant concentrations even if they form spherical micelles near cmc.27 The counterion bmim+ in bmimDS has very less hydrophobicity but has a finite propensity to get incorporated in the micelles. It, therefore, lowers the cmc, but such a surfactant cannot be treated as the perfect catanionic surfactant due to its appreciable water solubility and therefore does not induce shape transition in the bmimDS micelles. However, omim+ and ddmim+ counterions get incorporated into the micelles due to their greater hydrophobicity, resulting in the formation of mixed micelles. Such a mixed micellization completely modifies the size and morphology of aggregates, so that larger aggregate-like vesicles rather than spherical micelles are formed at the higher concentration. The formation of vesicles in the case of omimDS, as a prototype, was confirmed by transmission electron microscopy (Figure 3).
Figure 3.
TEM micrographs of omimDS at (a) 2 mM and (b) 10 mM concentrations.
Kinetics of the Reaction between 16-ArN2+ and TBHQ in SDS and SAILs
As discussed above, the reaction between the probe 16-ArN2+ and TBHQ follows a second-order mechanism and the probe remains completely solubilized within the micelles with its active reaction center exposed toward the interface. This way the whole of the reaction is assumed to take place exclusively at the interface.28 Moreover, because almost more than 95% TBHQ is associated with the interface and when the reaction is run under the conditions of excess TBHQ, that is, [TBHQ] ≫ [16-ArN2+], the reaction is observed as a pseudo-first-order reaction. Under these conditions, the absorbance of 16-ArN2+ versus time must normally follow monoexponential decay, as given by the above-mentioned eq 3. However, if the reduction of 16-ArN2+ by the deprotonated form of TBHQ to form the products 16-ArH and t-butylquinone occurs via the formation of the diazoether intermediate as shown in Scheme 3 and as reported earlier by us10 recently in CTAB/C12E6 mixed micelles, the absorbance of 16-ArN2+ versus time then follows biexponential decay as per eq 9. The typical kinetic plots showing the decrease in absorbance of the probe during its reduction by TBHQ at different concentrations in SDS and different SAILs at pH 5.5 are represented in Figure 4. The kinetic data fitted very well to the biexponential decay given in eq 9 as clearly shown in the case of the 3 mM OmimDS surfactant system in the Supporting Information as a prototype (Figure S2).10 From the fitted values of kobs, Ai, and % kobsi, the weighted average observed rate constant (kobs) was calculated by using eq 12.10 We use variation of kobsav to discuss the effect of changing concentration of amphiphiles (SDS and SAILs) on the kinetics of 16-ArN2+ with TBHQ occurring within the interfacial region of the micelles. This procedure makes the comparison of kinetics between solutions of different concentrations easier in contrast to using kobs1 and kobs2 separately, but without affecting the data analysis.
Figure 4.
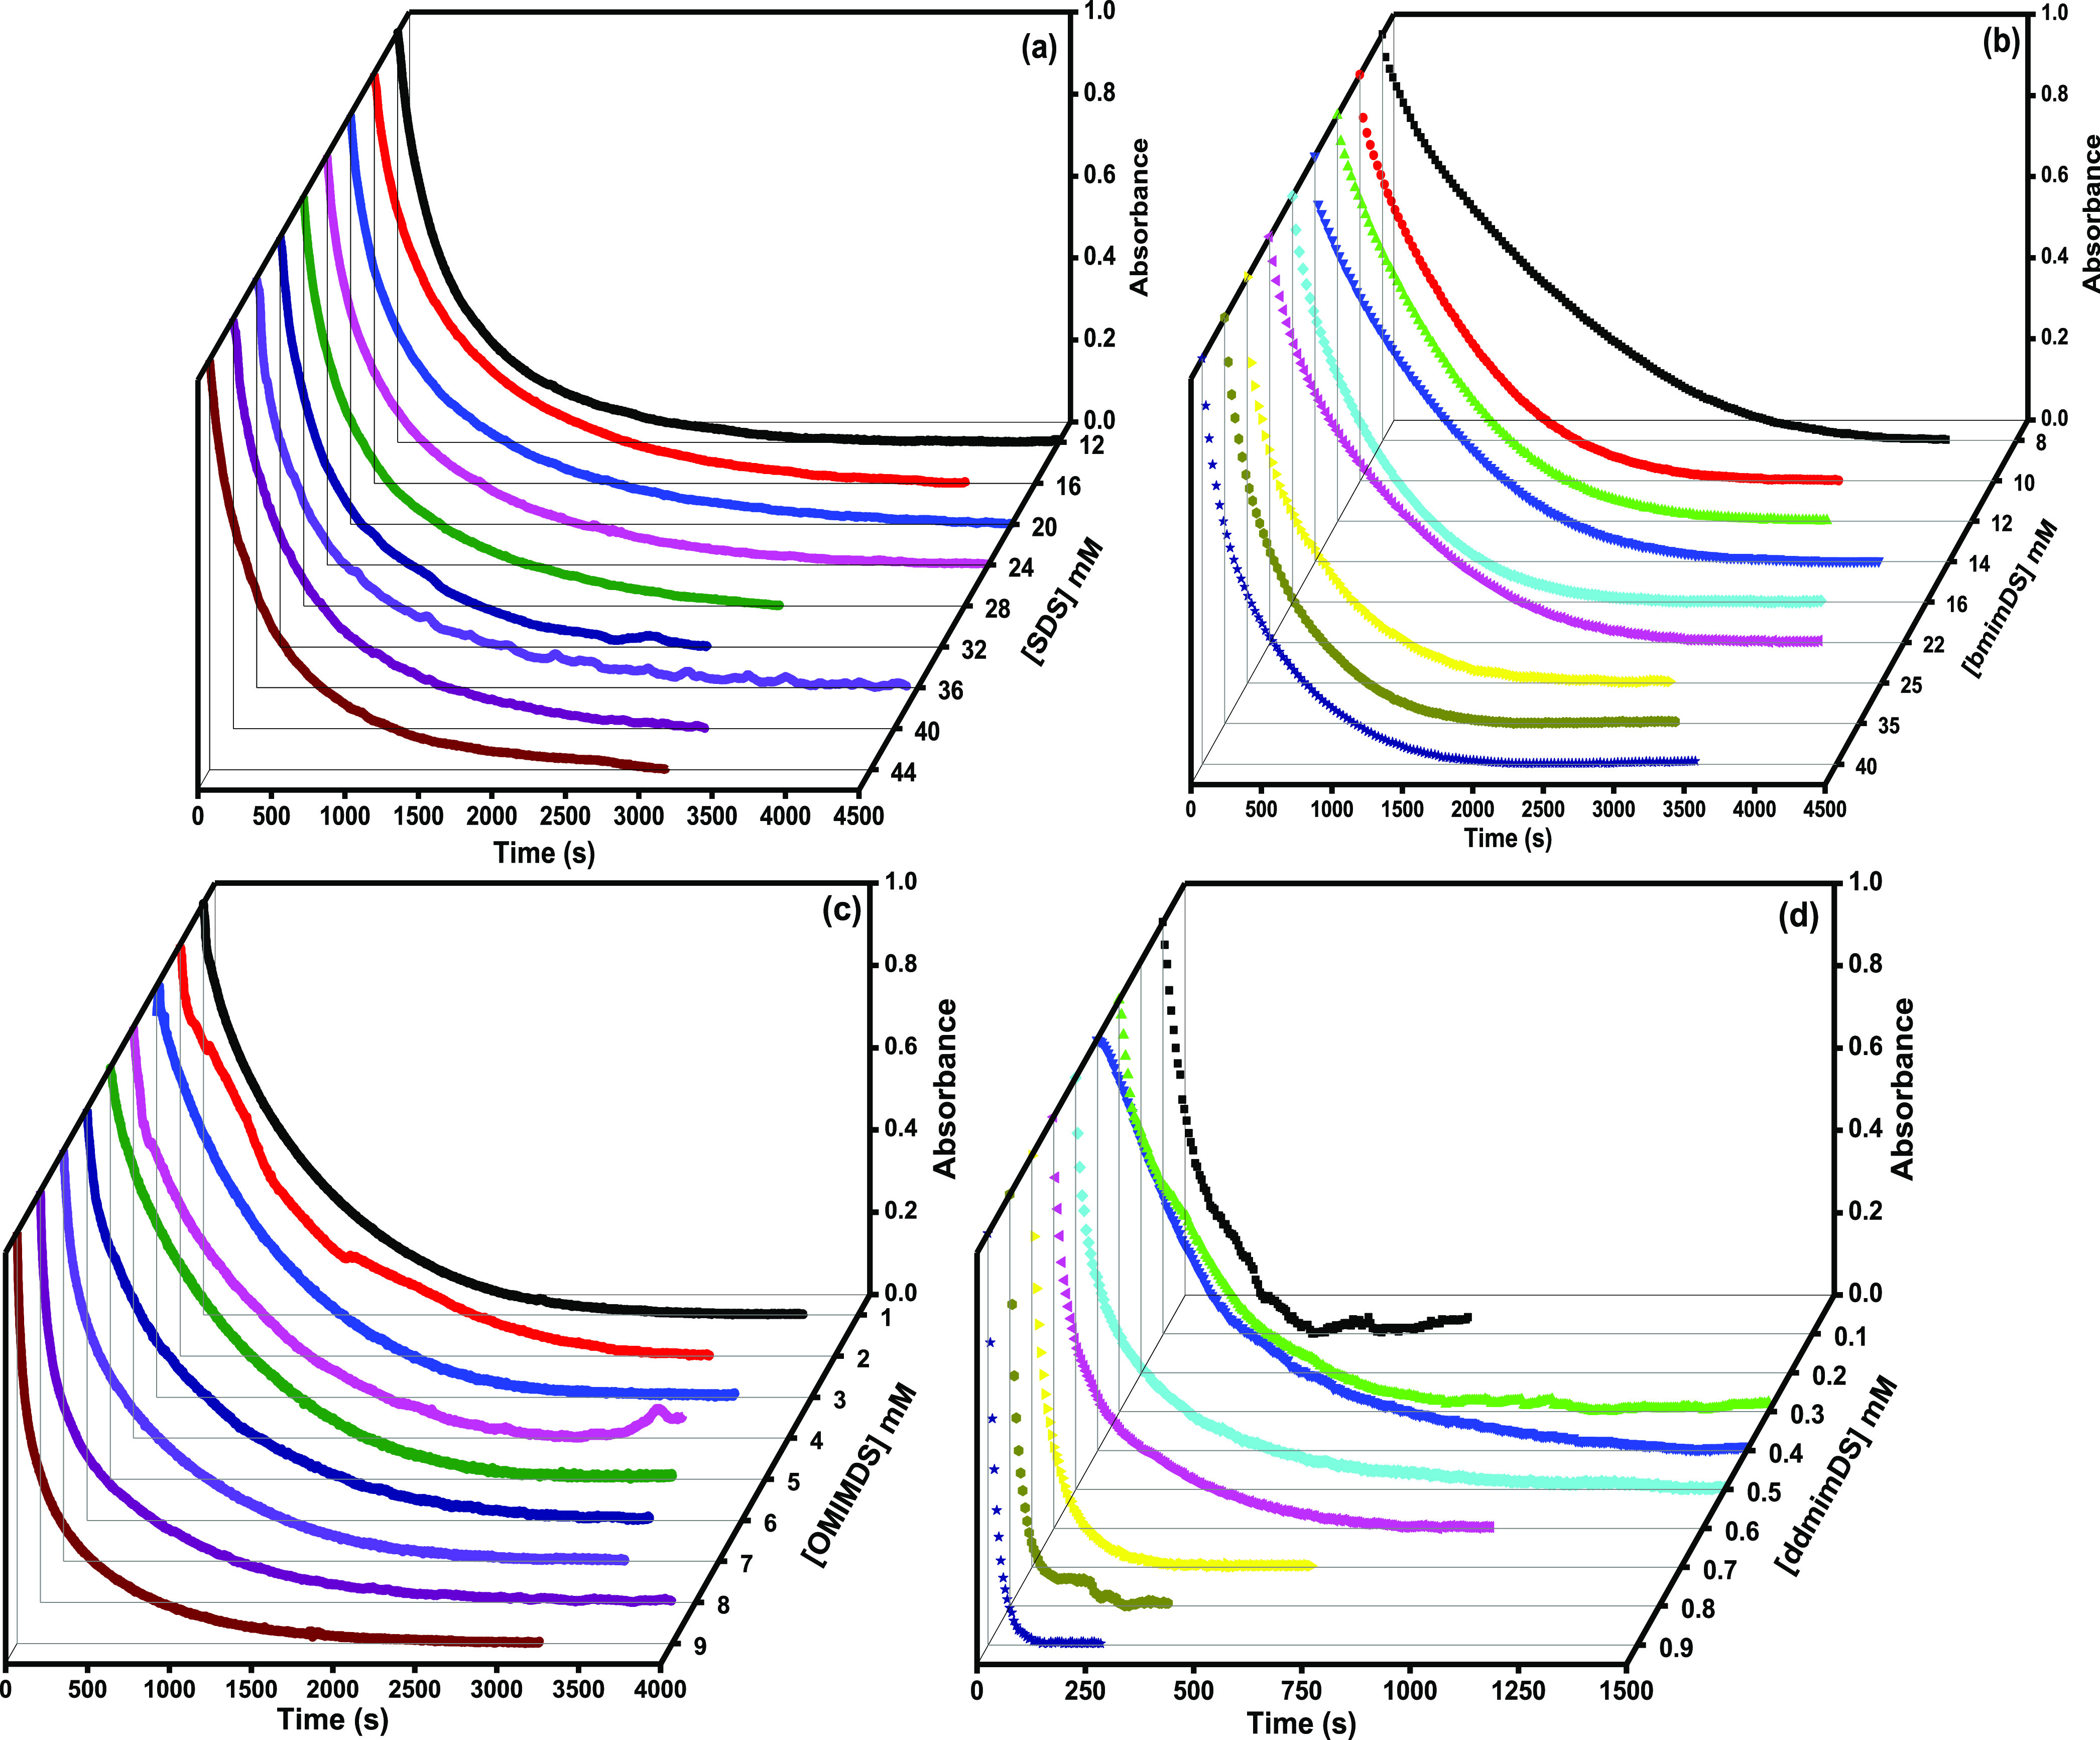
Plots of absorbance versus time of 16-ArN2+ and TBHQ at different concentrations of (a) SDS, (b) bmimDS, (c) omimDS, and (d) ddmimDS at pH 5.5 and 25 °C.
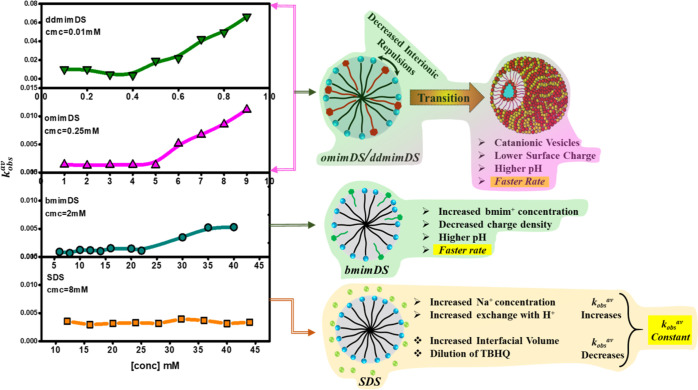
Figure 5 shows the variation of kobsav as a function of the concentration of SDS, omimDS, bmimDS, and ddmimDS above their respective cmc values. As clearly seen from the figure, kobs changes negligibly with the concentration of SDS. It has been reported4,7,10 that the increase in the concentration of the surfactant leads to the increase in the interfacial volume (due to the increase in the number of micelles and not due to the increase in the volume of individual micelles), which in turn leads to the decrease in the amount of TBHQ per unit interfacial volume and hence decrease in the kobs value because kobs = k2(TBHQ–)mφm under pseudo-first-order conditions, where (TBHQ–)m is the interfacial concentration of the TBHQ– anion in mol L–1 of interfacial volume and Φm is the volume fraction of the micellized surfactant (see eq 1). However, any change in the interfacial pH of the micelles changes the amount of the TBHQ– anion due to the shift of protonation–deprotonation equilibrium of TBHQ and hence affects the kobs values. In this context, no change in kobsav values with the SDS concentration can be attributed to the balance of these two opposing factors. Increasing SDS concentration (increase in volume fraction of the micellized surfactant) dilutes TBHQ in the interfacial region and tends to slow down the reaction. However, increasing the SDS concentration also increases Na+ ion concentration in the interface that gets exchanged with the H+ ions resulting in decrease in the interfacial H+ ion concentration and hence a rise in the interfacial pH, favoring the deprotonation of TBHQ at the interface to TBHQ– leading to an increase in the rate of the reaction. The compensation of these two effects results in an insignificant change in the kobs values with the concentration of SDS (Scheme 1). It is important to note that there is no change in the shape of the micelles with surfactant concentration up to 50 mM concentration of SDS36 used in this study (Figure 2).This indicates that the shape transition of the self-assemblies does not play any role in the variation of kobsav.
Figure 5.
Plots of kobsav of the reaction of TBHQ with 16-ArN2+ vs concentration at different anionic micelle–water interfaces carried out at pH 5.5 at 25 °C.
Scheme 1. Depiction of the Two Opposing Factors in the Case of the SDS Micellar System Accounting for the Constancy in kobs of the Reaction Rate.
In the case of bmimDS, kobsav remains constant till 22 mM [bmimDS] and then increases (Figure 5) though not very significantly (up to five times only).
The degree of counterion binding of bmimDS (β = 0.64) is slightly lower than SDS (β = 0.68). This can be ascribed to the presence of steric hindrance of organic counterions that would reduce the interaction between the counterion and hydrophilic headgroup, resulting in slightly fewer counterions existing at the micellar surface. It has been reported17 that the dodecyl (DS–) ions aggregate into micelles, while the imidazolium cation of bmim+ contacts the anion headgroup on the surface of micelles and butyl of bmim+ penetrates the micelle, as confirmed by detailed 1H NMR studies. Such a mechanism indicates a much looser interface of bmimDS micelles than SDS micelles. This significantly lowers charge density on the bmimDS micellar interface, inviting less H+ ions on the surface and contributing to an increase in interfacial pH. In the context of the abovementioned discussion, an increase in surfactant concentration of bmimDS would contribute two factors to the kobsav values. The decrease in kobs due to dilution of TBHQ in the interfacial region and increase in kobsav due to the increase in interfacial pH owing to the combined effect of two reasons, viz., increase in bmim+ concentration in the interfacial region and simultaneous decrease in the charge density of the micellar interface due to incorporation of the butyl hydrophobic tail of bmim+ in the micelles.29 The slight increase in kobs values above 22 mM bmimDS concentration (Figure 5) could be ascribed to the predominant effect of the latter factor. In this surfactant system, no change in the micellar size was indicated by DLS (Figure 2), excluding the contribution of the shape transition effect on variation of the kobsav values with [bmimDS].
In the case of omimDS and ddmimDS surfactants, kobsav first remains almost constant and then begins to increase sharply above 5 and 0.4 mM, respectively. The increase is about 10 and 20 times for omimDS and ddmimDS, respectively, which is significantly large. In this case, an increase in surfactant concentration of omimDS or ddmimDS would contribute three factors to the kobs values: (a) decrease in kobsav due to dilution of TBHQ in the interfacial region, (b) increase in kobs due to increase in interfacial pH due to the combined effect of (i) increase in omim+ or ddmim+ concentration in the interfacial region and (ii) simultaneous decrease in the charge density of the micellar interface due to incorporation of the octyl or dodecyl hydrophobic tail of omim+ or ddmim+ in the micelles, and (c) increase in kobsav due to the formation of catanionic vesicles, which, being compact, have been reported to possess a lower surface charge due to the presence of both the oppositely charged ions. This renders their interface depleted of the H+ ions29 and hence contributes to an increase in the rate of the reaction. The significant increase in kobs values above 5 mM omimDS and 0.4 mM ddmimDS concentrations (Figure 5) could, therefore, be ascribed to the predominant combined effect of latter two factors.
Micellar Shape Transition in bmimDS/omimDS and bmimDS/ddmimDS Mixed Micelles
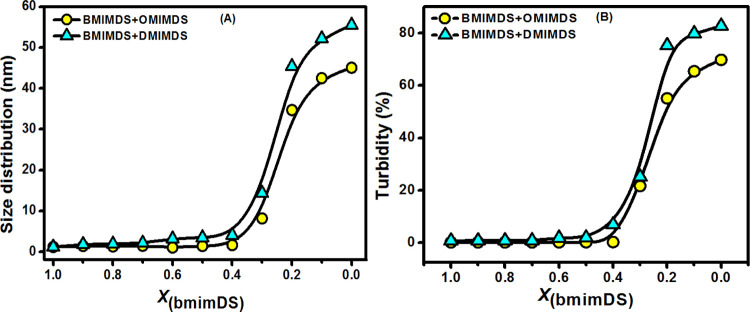
To find the effect of change in the type of counterion of the negatively charged dodecylsulfate micelles on the chemical reactivity of the interfacial reaction between TBHQ and 16-ArN2+, we studied the morphological changes in the aggregate structures as a function of changing mole fraction of bmimDS in the mixed micelles of bmimDS/omimDS and bmimDS/ddmimDS at a fixed 20 mM total surfactant concentration. These experiments would help to understand the effect of replacing the small alkyl chain imidazolium counterion, bmim+, with its long-chain counterpart, omim+ or ddmim+ on the morphological changes and hence the impact on interfacial chemical reactivity. The long-chain imidazolium counterions have a stronger propensity to get incorporated into the micelles, transform them into the catanionic system, and hence induce micelle-to-vesicle transition. Figure 6 shows the size distribution variation as a function of mole fractions of omimDS (XomimDS) and ddmimDS (XddmimDS) in bmimDS/omimDS and bmimDS/ddmimDS mixed surfactant systems, respectively, with the corresponding changes in the turbidity. Figure 6a reveals that the size of the microstructures remains small and almost constant up to a certain XomimDS/ddmimDS and increases abruptly, thereafter, on further increasing the mole fraction of omimDS/ddmimDS. This suggests that the small micelles are favored at low XomimDS/ddmimDS, which transform into the vesicles at higher XomimDS/ddmimDS validated by the concomitant increase in the turbidity of these two mixed surfactant systems being the first sign of vesicle formation (Figure 6b). As a prototype, the TEM pictures were taken in the bmimDS/ddmimDS mixed system at a composition corresponding to the micellar region (XddmimDS = 0.1) and to the vesicular region (XddmimDS = 0.9). As can be seen from Figure 7a,b, the smaller microstructures are present at XddmimDS = 0.1, while as at XddmimDS = 0.9, larger microstructures could be seen with higher average dimensions.
Figure 6.
Variation of the size distribution (a) and turbidity (b) as a function of mole fraction of omimDS or ddmimDS (XomimDS/XddmimDS) in mixed systems of bmimDS + omimDS and bmimDS + ddmimDS at 25 °C.
Figure 7.
TEM micrographs of ddmimDS + bmimDS at (a) XddmimDS = 0.1 and (b) XddmimDS = 0.9.
The pure bmimDS surfactant forms spherical micelles, while the pure omimDS or ddmimDS form the vesicles at 10 mM concentration, as indicated by the results presented above. Therefore, the mixed systems of bmimDS with omimDS or ddmimDS offer the advantage of having sphere-to-vesicle transition as we go from pure bmimDS to pure omimDS or ddmimDS. On increasing the omimDS or ddmimDS mole fraction in the bmimDS + omimDS or ddmimDS mixed surfactant systems, the hydrophilic bmim+ counterions get replaced by the more hydrophobic omim+ or ddmim+ counterions that have a high propensity to get incorporated into the micelles, reduce the headgroup repulsions, and induce the microstructural transition of micelles into vesicles. Above a certain mole fraction of omimDS or ddmimDS, the formation of catanionic aggregates is expected, which are reported to have a significant tendency to form the vesicles.18 The results presented above confirm this. In addition to these morphological changes, we anticipate significant changes in the H+ ion concentration at the micelle/vesicle water interface during the process of replacement of the bmim+ counterion by omim+ or ddmim+ or microstructural transition in the aggregates. The special CK method allows us to monitor such changes by following the changes in the rate constant of the reaction between TBHQ and 16-ArN2+ at the interface of these aggregates at constant total surfactant concentration as discussed below.
Kinetics of the Reaction between 16-ArN2+ and TBHQ in bmimDS/omimDS or bmimDS/ddmimDS Mixed Surfactant Systems
The kinetics of the reaction between TBHQ and 16-ArN2+ at the interface of aggregates formed in the mixed solutions of bmimDS/omimDS and bmimDS/ddmimDS at constant total DS– micellar concentration (20 mM) and at varied mole fractions of bmimDS was studied. These experiments give insights into the effect of changes in the composition of the interfacial region on the chemical reactivity, as the two different types of counterions differing in their hydrophobicity are being replaced at the interface with the change in mole fraction. The typical kinetic plots showing a decrease in absorbance values of the probe during its reduction by TBHQ at different mole fractions in mixed bmimDS + omimDS/ddmimDS at pH 3.5 are represented in Figure 8. The kinetic data fitted very well to the biexponential decay (eq 9). The effect of changing mole fraction of bmimDS in the mixed micellar systems on the kobsav values is depicted in Figure 9. From the figure, it is observed that kobs initially increases with the increase in the mole fraction of ddmimDS (up to XddmimDS = 0.3) or slightly for omimDS (up to XomimDS = 0.1) in the mixture of bmimDS + ddmimDS/omimDS. Thereafter, there is a significant decrease with the further increase in the mole fraction of ddmimDS or omimDS up to the mole fraction of XomimDS/ddmimDS = 0.7. An abrupt increase in the values of kobsav is observed after XomimDS/ddmimDS = 0.7, which coincides very well with the micelle-to-vesicle transition in the mixed surfactant systems, as observed in Figure 6. All these changes can be related to the H+ ion modulation at the interface due to the replacement of the bmim+ counterion by omim+ or ddmim+ counterions. It is expected that there would be no dilution effect on kobs in these mixed surfactant systems because the total surfactant concentration is kept constant at 20 mM.
Figure 8.
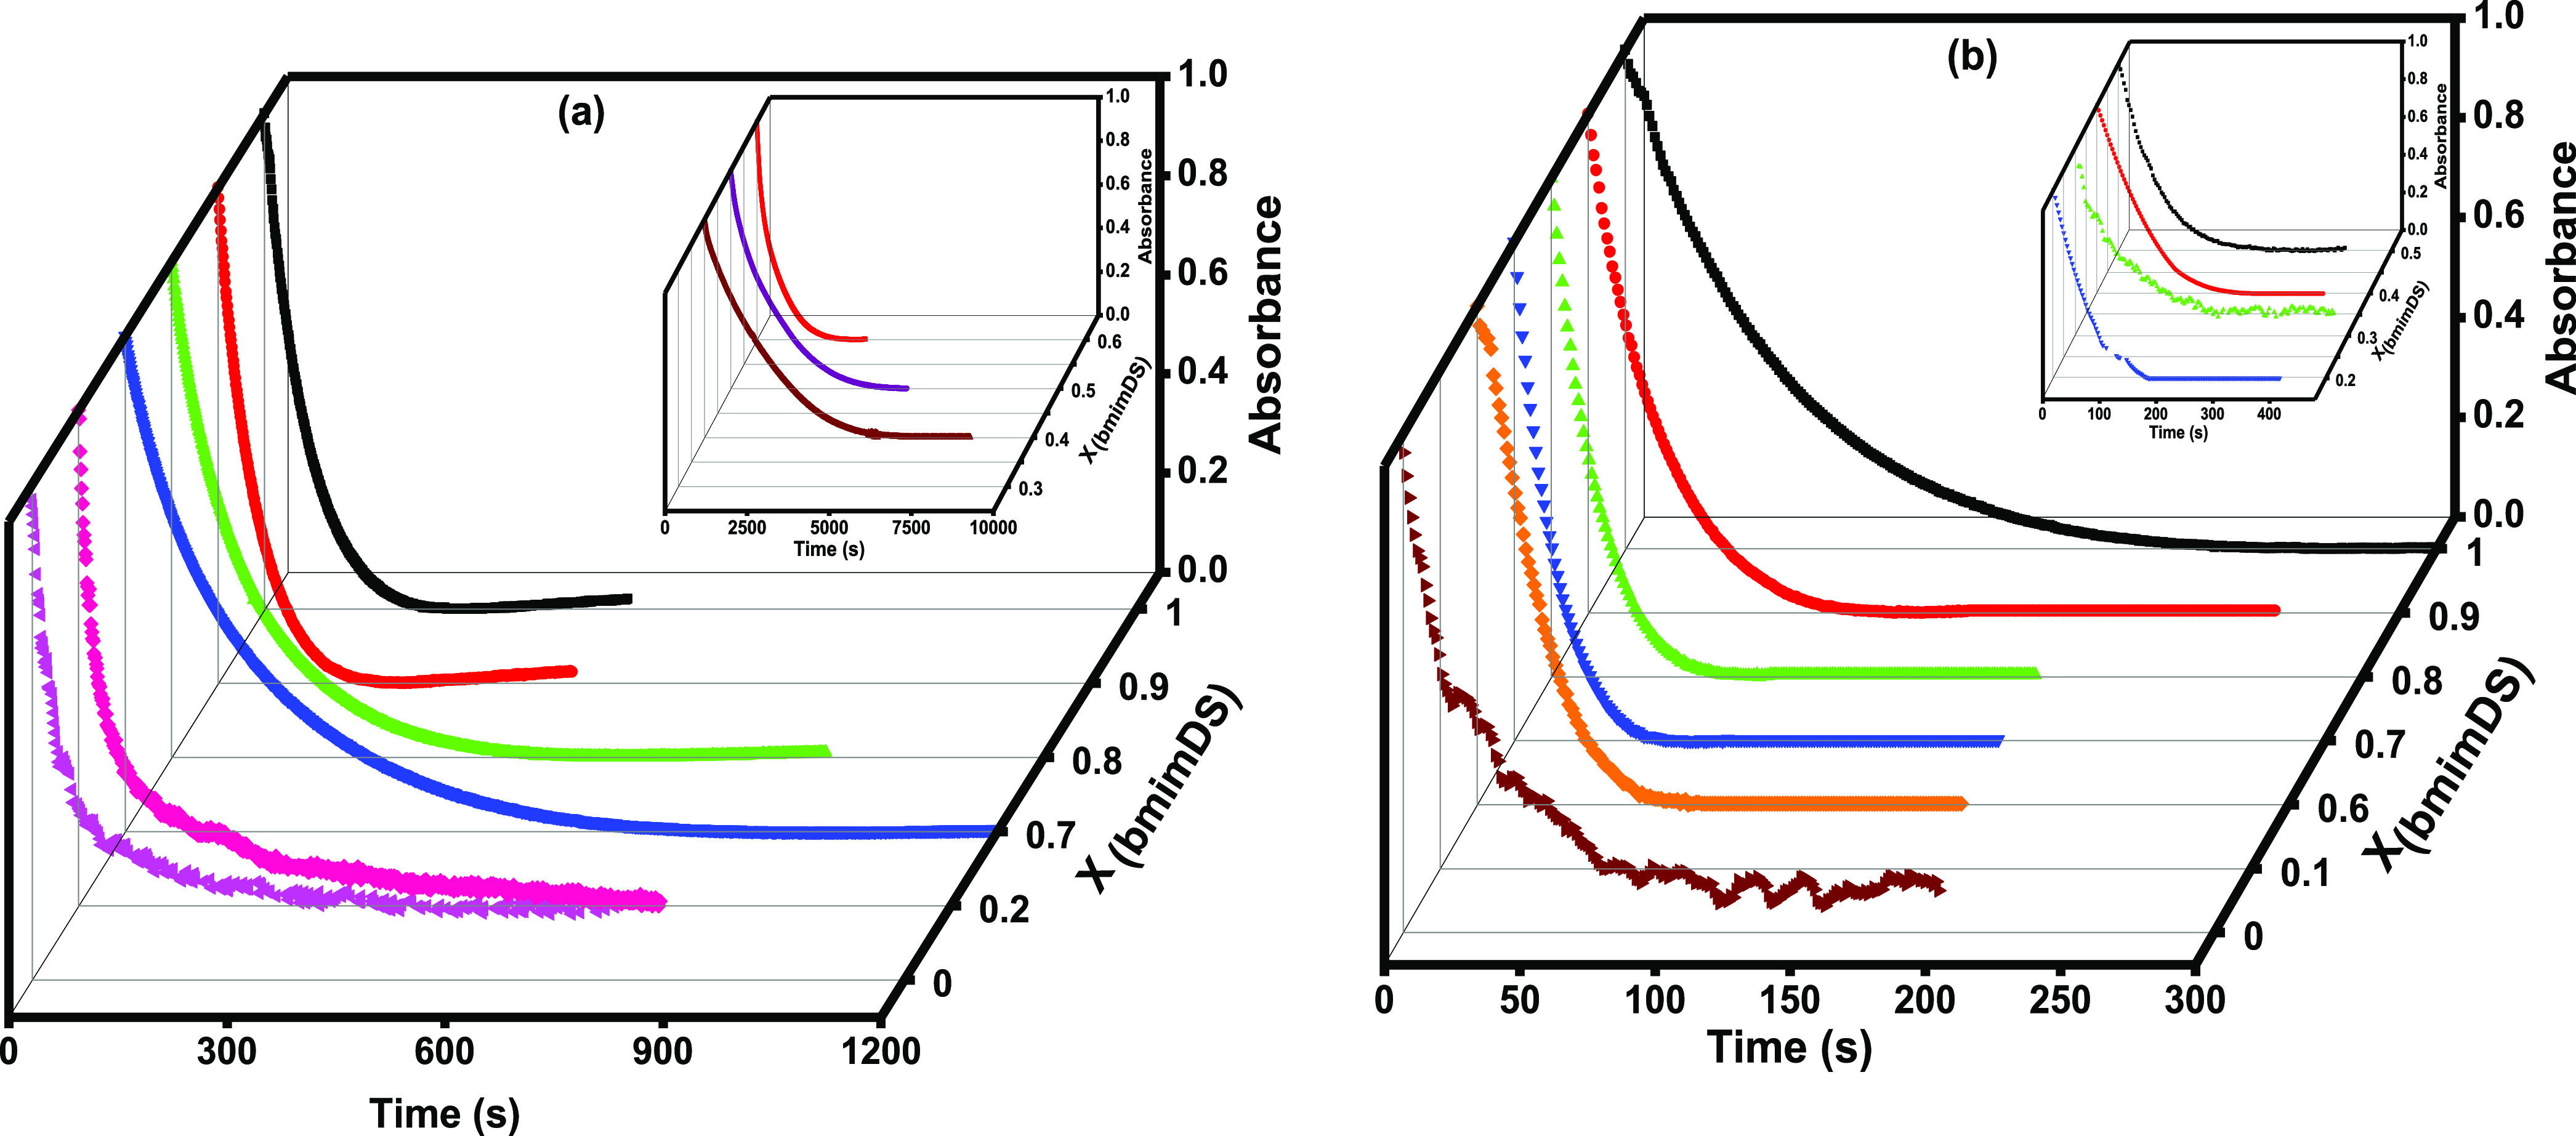
Kinetic plots of absorbance versus time of 16-ArN2+ and TBHQ at different mole fractions of (a) bmimDS + omimDS and (b) bmimDS + ddmimDS (the insets show the kinetic plots in some mole fractions, wherein the reaction took longer time to complete) at pH 3.5 at 20 mM total surfactant concentration at 25 °C.
Figure 9.
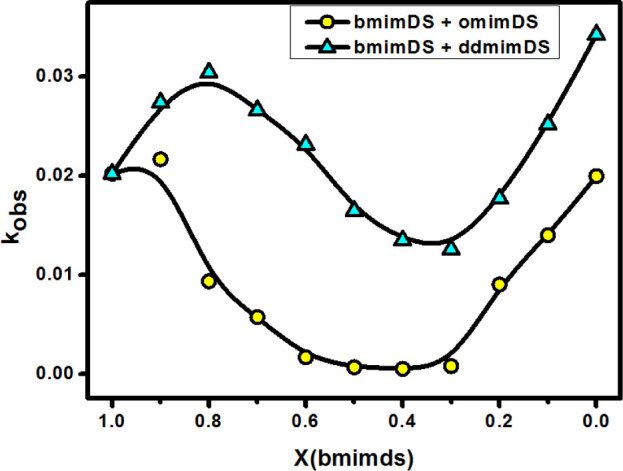
Variation of kobsav with the mole fraction of bmimDS in two mixed surfactant systems of bmimDS + omimDS and bmimDS and ddmimDS at a total constant surfactant concentration of 20 mM at 25 °C.
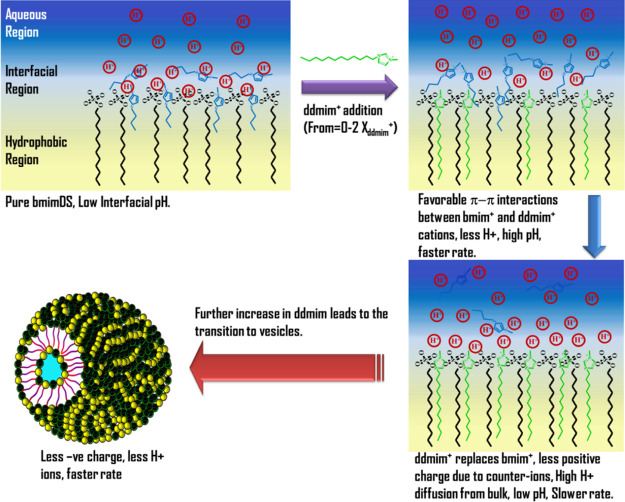
The slight increase in the kobsav values at the low mole fractions of ddmimDS or omimDS indicates that there is a slight increase in pH at the interface. The more hydrophobic ddmim+ or omim+ counterions having amphiphillic character tend to insert their alkyl chains into the DS– micelles and form ion pairs with the DS– headgroups aided by the electrostatic attraction and the hydrogen bonding ability between the hydrogen of imidazolium and oxygen of the sulfate group.17 This expectedly would favor the release of some of the bmim+ counterions inserted into the micelles into the interfacial region resulting in the accumulation of a large fraction of bmim+ counterions in the interfacial region, which is facilitated by its high stoichiometric mole fraction in the mixed systems at low XomimDS/ddmimDS and favorable π–π interactions between imidazolium of omim+/ddmim+ and bmim+ near the interface. This would favor a significant decrease in the effective negative charge of the interface resulting in the decrease of interfacial H+ ion concentration (or increase in the interfacial pH), leading to an increase in the rate of reaction (i.e., kobs values).
On further increasing the mole fraction of ddmimDS/omimDS, it is observed that the rate of reaction decreases steeply up to the mole fraction of 0.7, indicating that the pH at the interface decreases significantly. At intermediate mole fraction values of ddmimDS or omimDS, a significant amount of omim+ or ddmim+ gets incorporated into the micelles, resulting in the displacement of bmim+ counterions present in the interface. This results in an increase in the overall effective negative charge at the interface and hence an increase of the influx of H+ ions toward the interface and hence decrease in the pH with the consequent decrease in the rate of the reaction (or kobsav values). On further increasing the ddmimDS or omimDS mole fraction in the mixed micelles beyond 0.7, the rate of reaction again exhibits a significant increase, which coincides very well with the micelle-to-vesicle transition composition of the mixed surfactant systems (Figure 6). In the high mole fraction region of ddmimDS or omimDS, the predominant ddmim+ or omim+ counterions get incorporated into the micelles, resulting in the microstructural transition from micelles to vesicles due to the catanionic surfactant-like behavior of ddmimDS and omimDS as explained earlier. In the catanionic systems, there occurs a significant charge neutralization due to the ion-pair formation, thus resulting in the release of H+ ions from the interfacial region. In other words, the interfacial pH increases, resulting in an increase in the deprotonation of TBHQ with a consequent increase in the rate of reaction. Such variation in the chemical reactivity between TBHQ and 16-ArN2+ at the interface of mixed aggregates of omimDS/ddmimDS and bmimDS is depicted schematically in Scheme 2.
Scheme 2. Scheme Depicting the Variation of Counterions and H+ Ion Concentration at the Interface of ddmimDS + bmimDS Aggregates as a Function of Changing Mole Fraction of the ddmimDS Surfactant and Its Possible Effect on the Chemical Reactivity of the Interfacial Reaction Occurring between TBHQ and 16-ArN2+.
Solubilization and Stabilization of Curcumin
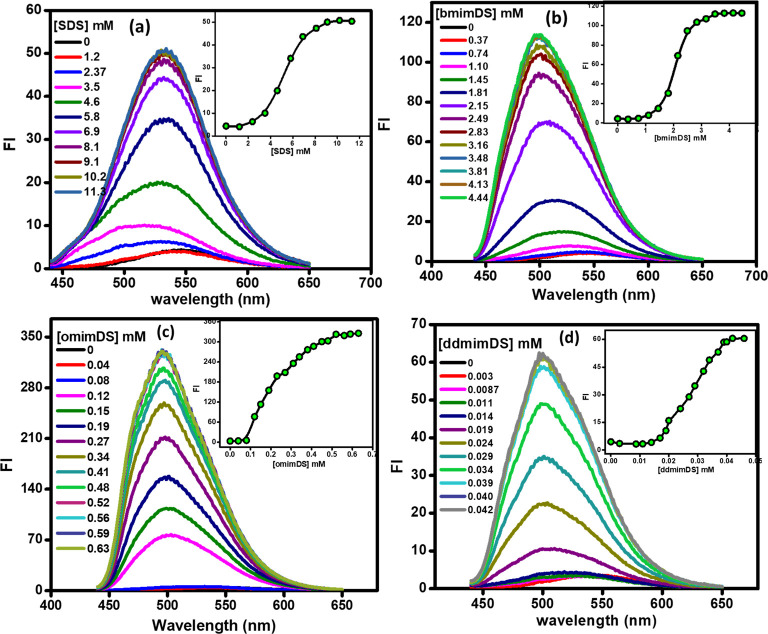
The changes in the interfacial pH of the individual and mixed surfactant systems rationalized by using the CK method can be utilized to understand the properties/stability of a bioactive molecule like curcumin (known to exhibit the pH-dependent stabilization)30 in the micellar pseudophase. Such a study could also help us to understand the influence of the modulation of pH at the interface of micellar systems to stabilize such important bioactive molecules. Therefore, to evaluate the stability of curcumin in the surfactant assemblies, we first studied the solubilization of curcumin in the single systems of SDS and SAILs by following the changes in the fluorescence intensity and shifts in the emission maximum wavelength of curcumin with the increase in the concentration of the SAILs. Figure 10 depicts the changes in the spectral features of curcumin with the increase in the concentration of individual surfactant/SAIL systems, viz., SDS, bmimDS, omimDS, and ddmimDS. As is evident from the figure, with the increase in the concentration of surfactants, the fluorescence intensity of curcumin exhibits a steady increase initially below the cmc of the surfactant/SAILs, after which the fluorescence intensity shows an abrupt increase (insets of Figure 10) with the simultaneous blue shift in emission maximum of curcumin signifying the change of the microenvironment from the more polar aqueous to the less polar micellar region, thereby validating the solubilization of curcumin inside the micelles in all of the studied surfactant systems. Similarly, the solubilization of curcumin in the mixed surfactant systems of omimDS + bmimDS and ddmimDS + bmimDS at two different mole fractions was carried out, and the solubilization of curcumin was again inferred from the increase in the fluorescence intensity and the blue shift in the emission maxima with the increase in the concentration of such mixed SAIL systems (Figure S3).
Figure 10.
Fluorescence spectra of curcumin with the increase in the concentration of (a) SDS, (b) bmimDS, (c) omimDS, and (d) ddmimDS (insets represent the change in fluorescence intensity as a function of surfactant concentration).
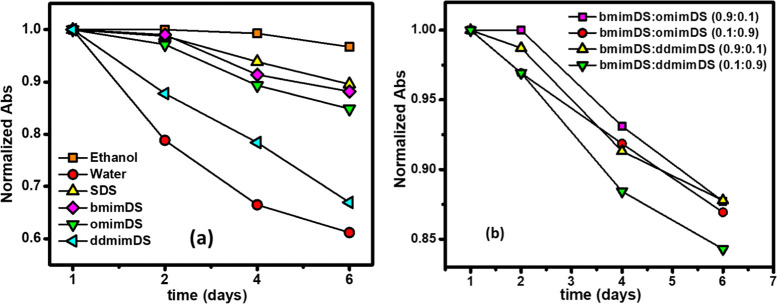
It is also well known that curcumin exhibits pH-dependent degradation/stabilization kinetics. Such degradation is very rapid in neutral and alkaline solutions due to the favorable keto–enol tautomerizaton.31 The interfacial pH changes in the surfactant/SAIL solutions, which are brought about by the changes in the nature of the counterion, are, therefore, expected to be reflected in the curcumin degradation kinetics. As such, we monitored the changes in the UV–visible spectra of curcumin in different surfactant media for 6 days (Figure 11).32 The stability test was also performed in ethanol to ascertain the slow degradation kinetics of curcumin in organic solvents. In water (Figure 11b), curcumin exhibited a fast degradation for 6 days, which was slowed down in the presence of the micellar systems. However, among the micellar systems, the degradation of curcumin was found to be fastest in ddmimDS and slowest in SDS following the order as: SDS < bmimDS < omimDS < ddmimDS. As deduced from the results of the CK method in SDS and SAILs (discussed above), the H+ abundance at the micellar interface follows the order SDS > bmimDS > omimDS > ddmimDS. Therefore, curcumin encapsulated in the SDS micelles is surrounded by the interfacial layer very rich in H+ ions, which lends remarkable stabilization to the encapsulated curcumin. The surfactant ddmimDS possesses the least H+ ions in the interfacial region and hence shows fast degradation of solubilized curcumin.
Figure 11.
Normalized absorbance vs time graph of curcumin (10 μM) in the (a) aqueous system of SDS (=25 mM); bmimDS (=15 mM); omimDS (=5 mM) and ddmimDS (=0.5 mM) and (b) in the aqueous mixed systems of omimDS + bmimDS and ddmimDS + bmimDS having mole fraction as mentioned in the legends of the plot and total concentration of 20 mM. The absorbance was taken at the wavelength of maximum absorbance of curcumin (λ = 428 nm).
In the mixed micellar systems of omimDS + bmimDS and ddmimDS + bmimDS, the degradation kinetics of curcumin was found to be slower in the lower mole fraction (XomimDS/ddmimDS = 0.1) regions of omimDS and ddmimDS, where the presence of the micelles is predominant. This is because the pH at the interface of such a mixed system at this mole fraction is higher (indicated by the higher kobsav value), as explained above in the CK method in the mixed SAIL systems. However, in the higher mole fraction region of omimDS and ddmimDS (XomimDS/ddmimDS = 0.9) where the presence of vesicles is predominant, the degradation of curcumin is comparatively faster, which is in good concordance with the insight that the vesicular interface is depleted of H+ ions as inferred from the results of the CK method. The interfacial region of mixed vesicle systems has higher pH due to the charge screening via ion-pair formation in catanionic-like systems, which renders curcumin less stable. In one study, Mehta et al.33 reported that a significant number of curcumin molecules remain near the polar headgroup region of the vesicles that was confirmed by various techniques indicating that the H+ ion-depleted interface has an effect of increasing the degradation of the curcumin.
In conclusion, the degradation kinetics of curcumin is consistent with the changes in the pH of the micellar interface of different SAILs and the shape transitions with changing mole fractions, as explained in the previous sections. Therefore, the information obtained from the CK experiments about the interface can effectively be used to determine the physicochemical properties of the molecules, which are dependent on the interfacial characteristics.
Conclusions
The CK method that utilizes the reduction reaction of 16-ArN2+ by TBHQ occurring exclusively at the micelle–water interface was successfully applied to study the complex interface of SAILs in their single and mixed states. The structural transitions of aggregates of the SAILs from the micellar to vesicular form were observed both in single and mixed micelles of SAILs above a certain concentration or composition and were verified by turbidity, DLS, and TEM measurements. Reduction kinetics of 16-ArN2+ at the interface of aggregates depends on the acid/base equilibria at the interface. Studying this reaction at the interface of SAIL aggregates gave an insight into the changes in the interfacial H+ ions with the change in the hydrophobicity of the counterions of SAILs and the morphological changes from micelles to vesicles as a function of concentration or composition. Results show that the vesicular interfaces of SAILs have a significantly low negative charge and invite fewer H+ ions to the interfaces indicated by the higher rate of reaction between 16-ArN2+ and TBHQ at such interfaces. Micellar interfaces, however, have a comparatively higher negative charge, inviting more H+ to the interface, and hence have lower rates of reaction. The CK method exclusively shows that the hydrophobicity of the imidazolium-based counterion plays a significant role in modulating the H+ ion concentration at the interface. More hydrophobic counterions like ddmim+/omim+ eventually form the micelles with less negative charge due to the significant incorporation of these counterions into the micelles leading to less H+ ion concentration at the interface and hence enhanced rate of reaction between 16-ArN2+ and TBHQ. These changes in the interfacial pH that have been inferred from the results of the CK method had an excellent correlation with the stability of curcumin within these self-assemblies, which exclusively depends on the pH of the medium. Curcumin was found to be unstable in ddmimDS, whose interfacial pH is high compared to short-chain SAILs. Moreover, the curcumin had good stability in the micellar form of the aggregates compared to that in the vesicular aggregates due to the higher pH at the interface of the latter. The results of this study highlight the importance of the CK method in selecting the appropriate medium/conditions for stabilization of bioactive molecules like curcumin, whose degradation significantly depends on the pH of the medium.
Experimental Section
Materials
SDS, 1-butyl-3-methylimidazolium chloride (bmimCl), 1-octyl -3-methylimidazolium chloride (omimCl), 1-dodecyl-3-methylimidazolium chloride (ddmimCl), and t-butylhydroquinone (TBHQ, 97%) were purchased from Sigma. SDS and TBHQ were recrystallized from MeOH three times before use. 4-Hexadecylbenzenediazonium tetrafluoroborate (16-ArN2BF4) was synthesized from commercially obtained 4-hexadecylaniline according to the reported procedure.28 DCM was a Fisher Scientific product. Methanol and acetonitrile were purchased from Himedia.
Synthesis of SAILs
Synthesis of SAILs was carried out according to the procedure described in the literature.34 Briefly, 48.4 mM solution of [Cnmim][Cl] (n = 4,8, and 12) and 43.6 mM of SDS were mixed in 20 mL of water and heated at 60 °C with continuous stirring for 24 h. Water was then removed under vacuum using rotavapor, and a white solid precipitate was obtained. The product was then purified by adding DCM, which formed two layers; SAIL in the lower layer, while as NaCl in the upper layer. The product was separated and washed two to three times with water. The extract was distilled to make it solvent free and then dried under a vacuum. The reaction scheme for the synthesis of SAILs and the structure of SAILs used in this study are given in Scheme 3. The characterization of the synthesized SAILs was performed by FT-IR at 25 °C within the range of 400–4000 cm–1 (Supporting Information, Figure S1). All the FT-IR spectra were taken in attenuated total reflectance mode. The spectra recorded were an average of 16 scans at a resolution of 4 cm–1 using resolution pro software version 2.5.5.
Kinetics of the Reaction between 16-ArN2+ and TBHQ in Different Surfactant Systems
Stock solutions of 16-ArN2+ (0.005 M) and TBHQ (0.05 M) were prepared in ice-cold acetonitrile. All the reactions were carried out under the pseudo-first-order reaction conditions with [TBHQ] ≈ 10 × [16-ArN2+]. For that, 12 μL of the stock solutions of both 16-ArN2+ and TBHQ was added to the solution of SAILs to make their final concentrations, 0.06 and 0.6 mM, respectively. Because the rate of reaction between 16-ArN2+ and TBHQ increases with an increase in pH and approaches the diffusion control limit near the pKa of TBHQ (pKa ≈ 10), the reactions were carried out at [HCl] = 3.2 × 10⁻⁶ M (pH ≈ 5.5) in pure surfactants and at [HCl] = 3.2 × 10⁻⁴ M (pH ≈ 3.5) in the mixed surfactant systems to monitor the reaction at an observable time scale. The reaction between 16-ArN2+ and TBHQ was monitored as a decrease in the absorbance of 16-ArN2+ at 272 nm. For single surfactant solutions, various concentrations above their cmc values were used to carry out the kinetic experiments. In the case of mixed surfactant solutions, we used two types of surfactant mixtures: one between bmimDS and omimDS and the other with bmimDS and ddmimDS. In these cases, the mole fraction of bmimDS, XbmimDS, was varied from 0 to 1 in increments of 0.1 at the total surfactant concentrations of 20 mM. All the experiments were carried out at 25.0 ± 0.1 °C.
Concept of the CK Method
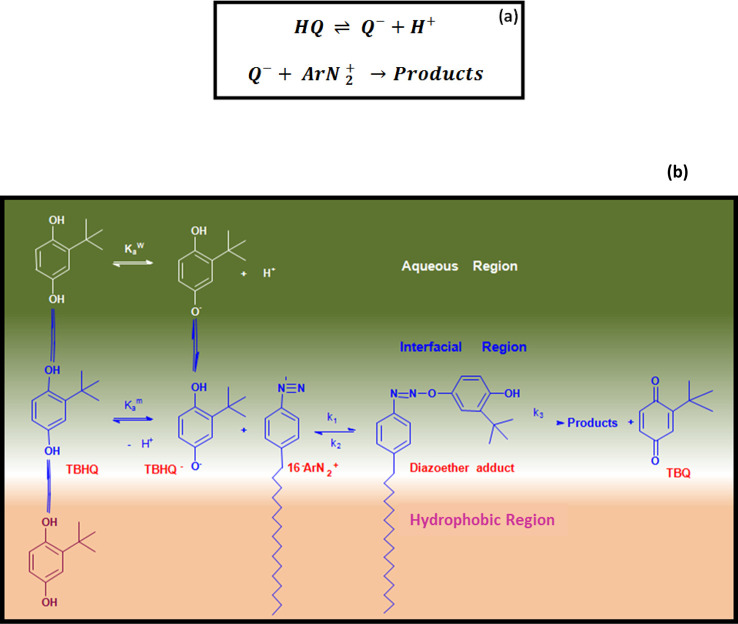
The interfacial region of the association colloids has different properties and chemical composition like interfacial water, counterion, and head-group molarities as compared to the hydrophobic region of the aggregate or the aqueous bulk solution.1,4,10 The hydration effects of the headgroup and the counterion interactions at the interface tend to have a peculiar effect on chemical reactivity, which is different from that in the bulk solution.35 It is well established that the benzenediazonium ion (ArN2+) undergoes second-order reduction reaction with hydroquinone (HQ) in a two-step reaction, as shown in Scheme 4a. The first step involves the oxidation of HQ around its pKa value (≈10), which is reversible w.r.t pH. In the second step, which is also the rate-determining step, the monobasic hydroquinone anion (HQ–) reacts with ArN2+ whose rate constant depends upon the concentration of HQ–, which is controlled by adjusting the solution pH making this reaction strongly dependent on pH.36 This concept forms the basis of the CK method. To apply this method to the association colloids to study the interface, 4-hexadecylbenzenediazonium ion, 16-ArN2+ is used as a probe, which undergoes the reduction reaction with t-butylhydroquinone (TBHQ) through a similar mechanism.10 The long alkyl chain of 16-ArN2+ gets solubilized in the hydrophobic region of the micelle, and its charged headgroup is exposed to the interfacial region of the micelle. The reactions are generally carried out at low pH to monitor the rate of reaction on a large time scale. Because >95% of TBHQ is associated with the interfacial region, the correction for the partial association of TBHQ to the micelles is not necessary. The mechanism of the reaction at the interface is shown in Scheme 4b.37,38 The rate equation for the bimolecular reaction within the interfacial region is given by
| 1 |
where k1 and kobs are the second- and pseudo-first-order rate constants, respectively, where TBHQ is in large excess over 16-ArN2+, ensuring first-order conditions. The square brackets, [ ], and parentheses, ( ), indicate molarity in units of moles/liter of solution volume for reaction in bulk solution and in moles per liter of interfacial volume for reactions in micelles. In micellar and other association colloid solutions, the volume for the reaction in the micellar pseudophase is proportional to the volume fraction of the surfactant aggregates, ϕm, and not their stoichiometric concentration in solution. Because the reaction is run under pseudo-first-order conditions, the change in [16-ArN2+] versus time follows a monoexponential eq 2 as per the integrated rate law of the decomposition of the reactant
| 2 |
Scheme 4. (a) Reaction Steps Showing Deprotonation of Hydroquinone and Its Subsequent Reaction with Arenediazonium Salt and (b) Mechanism of the Reduction of 16-ArN2+ and Deprotonation of TBHQ Leading to the Formation of Products 16-ArH and t-butylquinone via Formation of the Diazoether Intermediate.
In terms of absorbance values, eq 2 is converted to
| 3 |
where At, A∞, and A0 are the absorbance values at λmax = 272 nm at time t, infinity, and zero, respectively. We have recently shown the biphasic mechanism for the reduction of 16-ArN2+ by TBHQ in the mixed micelles of CTAB/C12E6, leading to the formation of products 16-ArH and t-butylquinone via the formation of the diazoether intermediate (Scheme 4b).10 Such a mechanism follows the following rate equation for the loss of the arenediazonium ion
| 4 |
where k1 and k2 are the second-order rate constants for the reaction between TBHQ– and 16-ArN2+ and the first-order rate constant of conversion of the diazoether adduct back to starting materials, respectively, in the interfacial region. The (diazoether) term is the concentration of the intermediate in mol L–1 of the interfacial volume. The integrated rate equation39 applicable to the decomposition of 16-ArN2+ with time as per the mechanism shown in Scheme 4b under these conditions is given by a biexponential eq 5
| 5 |
Where kobs1 and kobs2 are two parameters defined in eqs 6 and 7 that relate the three experimental rate constants used in the fitting of eq 5.
| 6 |
| 7 |
| 8 |
where k1 is the second-order rate constant between TBHQ– and 16-ArN2+ in the interfacial region, k1′ is the pseudo-first-order rate constant, and Φm is the volume fraction of the micellized surfactant.
In terms of absorbance, eq 5 can be written as.
| 9 |
where
| 10 |
| 11 |
where kobs1 and kobs2 are the rate constants for the initial faster and latter slower parts, respectively. A1 and A2 are the constants representing the % contribution of the corresponding kobs to the overall reaction. When the kinetics follows the biexponential kinetics, we can discuss the effect of changing the composition of the interface on the kinetics of 16-ArN2+, with TBHQ occurring within the interfacial region by using the variation of the observed weighted average rate constant, kobsAv, defined by
| 12 |
This makes the comparison of kinetics easier in contrast to using kobs1 and kobs2 separately, but without affecting the data analysis. Such a procedure is often used in fluorescence lifetime spectroscopy during which the decay profile of excited molecules usually fit multiexponential kinetics.40
Conductivity Measurements
Conductivity measurements were performed by using a Wensor WCM 20 conductometer with the sensitivity of 0.1 μS cm–1, and the temperature was controlled at 25.0 ± 0.1 °C by Thermoscientific water bath. The conductometer was initially calibrated by 0.01 M and 0.1 M KCl solution. The conductivity measurements of SAILs were carried by successively adding the stock solution of SAILs to water for the determination of cmc and degree of counterion binding of SDS and SAILs.
Structural Characterization of Microstructures
Transmission electron microscopy analysis was carried out by using JEOL TEM at an operating voltage of 200 kV. DLS measurements were carried out at 25 °C by using a LiteSizer 500 Anton Paar equipped with the semiconductor laser (40 mW, 658 nm). The samples were filtered using 0.2 μm filters before size distribution measurements and thermostated at 25 °C. The spectra recorded were an average of 10 runs at an angle of 90°. Turbidity measurements of the samples were carried out by measuring the transmittance at 400 nm using a Shimadzu (UV-1650) spectrophotometer. The temperature was kept constant at 25 °C by water bath (Brooke Field, ± 0.1 °C) attached to the spectrophotometer. The turbidity was calculated from the transmittance data using the equation: turbidity = 100 – %T.
Steady-State Spectrofluorometry
The solubilization of curcumin in SDS and the different SAILs was studied by recording the emission spectra of curcumin at 25 ± 0.1 °C using a Shimadzu RF-5301-PC Spectrofluorimeter excited at 423 nm at the slit width of 5/5 (excitation/emission). For solubilization experiments, 10 μM solution of curcumin was prepared in water by dispersing the stock solution of curcumin already prepared in ethanol. The stock solution of each surfactant was added successively to 2 mL of 10 μM solution of curcumin, and the fluorescence spectra were recorded after every addition. The additions were carried out in such a way that the concentrations below and above the cmc value of each surfactant were covered. In the case of mixed surfactant solutions, solubilization of curcumin was carried out in bmimDS + omimDS and bmimDS + ddmimDS solutions at two different mole fractions, viz., XbmimDS = 0.1 and 0.9 in each case.
UV–Vis Spectrophotometry
The stabilization of curcumin (10 μM) in SDS and different SAIL systems was studied by monitoring the absorbance of curcumin at λ = 428 nm for 6 days by using a Shimadzu UV 1650 spectrophotometer at 25 ± 0.1 °C.32 Due to the high turbidity of bmimDS + omimDS/ddmimDS at the XomimDS/ddmimDS = 0.9 system, the stability of curcumin was studied by taking absorbance values of aliquots of 10 μL from the solution into 2 mL of ethanol each day to avoid the hindrance caused by turbidity. All the experiments were carried out at 25 ± 0.1 °C maintained through a Brooke Field thermostat.
Acknowledgments
A.A.D. acknowledges MHRD, Govt. of India for providing funds for the project under Component 10 of the RUSA 2.0 scheme. S.A. acknowledges the financial support from the Council of Scientific and Industrial Research, HRDG, India under file no. (09/251(0059)/2015-EMR-1) as SRF. A.A.D. also acknowledges DST for providing financial assistance to the Department of Chemistry, the University of Kashmir under FIST for procuring some research-grade instruments.
Supporting Information Available
The Supporting Information is available free of charge at https://pubs.acs.org/doi/10.1021/acsomega.1c01119.
FTIR of SAILs and fluorescence spectra of curcumin (PDF)
The authors declare no competing financial interest.
Supplementary Material
References
- Romsted L. S. Do Amphiphile Aggregate Morphologies and Interfacial Compositions Depend Primarily on Interfacial Hydration and Ion-Specific Interactions? The Evidence from Chemical Trapping. Langmuir 2007, 23, 414–424. 10.1021/la062411k. [DOI] [PubMed] [Google Scholar]
- Keiper J.; Romsted L. S.; Yao J.; Soldi V. Interfacial compositions of cationic and mixed non-ionic micelles by chemical trapping: a new method for characterizing the properties of amphiphilic aggregates. Colloids Surf., A 2001, 176, 53–67. 10.1016/s0927-7757(00)00613-0. [DOI] [Google Scholar]
- Romsted L. S.; Bravo-Díaz C. Modeling chemical reactivity in emulsions. Curr. Opin. Colloid Interface Sci. 2013, 18, 3–14. 10.1016/j.cocis.2012.11.001. [DOI] [PubMed] [Google Scholar]
- Dar A. A.; Bravo-Diaz C.; Nazir N.; Romsted L. S. Chemical kinetic and chemical trapping methods: Unique approaches for determining respectively the antioxidant distributions and interfacial molarities of water, counter-anions, and other weakly basic nucleophiles in association colloids. Curr. Opin. Colloid Interface Sci. 2017, 32, 84–93. 10.1016/j.cocis.2017.09.001. [DOI] [Google Scholar]
- Gao X.; Bravo-Díaz C.; Romsted L. S. Interpreting Ion-Specific Effects on the Reduction of an Arenediazonium Ion by t-Butylhydroquinone (TBHQ) Using the Pseudophase Kinetic Model in Emulsions Prepared with a Zwitterionic Sulfobetaine Surfactant. Langmuir 2013, 29, 4928–4933. 10.1021/la400793g. [DOI] [PubMed] [Google Scholar]
- Pastoriza-Gallego M. J.; Losada-Barreiro S.; Bravo-Díaz C. Interfacial kinetics in octane based emulsions. Effects of surfactant concentration on the reaction between 16-ArN2+ and octyl and lauryl gallates. Colloids Surf., A 2015, 480, 171–177. 10.1016/j.colsurfa.2014.10.019. [DOI] [Google Scholar]
- Gu Q.; Bravo-Díaz C.; Romsted L. S. Using the pseudophase kinetic model to interpret chemical reactivity in ionic emulsions: Determining antioxidant partition constants and interfacial rate constants. J. Colloid Interface Sci. 2013, 400, 41–48. 10.1016/j.jcis.2013.02.024. [DOI] [PubMed] [Google Scholar]
- Gunaseelan K.; Romsted L. S.; Gallego M.-J. P.; González-Romero E.; Bravo-Díaz C. Determining α-tocopherol distributions between the oil, water, and interfacial regions of macroemulsions: Novel applications of electroanalytical chemistry and the pseudophase kinetic model. Adv. Colloid Interface Sci. 2006, 123–126, 303–311. 10.1016/j.cis.2006.05.007. [DOI] [PubMed] [Google Scholar]
- Bravo-Díaz C.; Romsted L. S.; Liu C.; Losada-Barreiro S.; Pastoriza-Gallego M. J.; Gao X.; Gu Q.; Krishnan G.; Sánchez-Paz V.; Zhang Y.; Dar A. A. To Model Chemical Reactivity in Heterogeneous Emulsions, Think Homogeneous Microemulsions. Langmuir 2015, 31, 8961–8979. 10.1021/acs.langmuir.5b00112. [DOI] [PubMed] [Google Scholar]
- Dar A. A.; Romsted L. S.; Nazir N.; Zhang Y.; Gao X.; Gu Q.; Liu C. A novel combined chemical kinetic and trapping method for probing the relationships between chemical reactivity and interfacial H2O, Br– and H+ ion molarities in CTAB/C12E6 mixed micelles. Phys. Chem. Chem. Phys. 2017, 19, 23747–23761. 10.1039/c7cp03413j. [DOI] [PubMed] [Google Scholar]
- Gehlot P. S.; Kulshrestha A.; Bharmoria P.; Damarla K.; Chokshi K.; Kumar A. Surface-Active Ionic Liquid Cholinium Dodecylbenzenesulfonate: Self-Assembling Behavior and Interaction with Cellulase. ACS Omega 2017, 2, 7451–7460. 10.1021/acsomega.7b01291. [DOI] [PMC free article] [PubMed] [Google Scholar]
- Shi L.; Zheng L. Aggregation Behavior of Surface Active Imidazolium Ionic Liquids in Ethylammonium Nitrate: Effect of Alkyl Chain Length, Cations, and Counterions. J. Phys. Chem. B 2012, 116, 2162–2172. 10.1021/jp211338k. [DOI] [PubMed] [Google Scholar]
- Chat O. A.; Maswal M.; Hassan P. A.; Aswal V. K.; Rather G. M.; Dar A. A. Effect of mixed micellization on dimensions of 1-butyl-3-methylimidazolium dodecylsulfate micelles in presence of electrolytes. Colloids Surf., A 2015, 484, 498–507. 10.1016/j.colsurfa.2015.08.032. [DOI] [Google Scholar]
- Nandwani S. K.; Malek N. I.; Chakraborty M.; Gupta S. Potential of a Novel Surfactant Slug in Recovering Additional Oil from Highly Saline Calcite Cores during the EOR Process: Synergistic Blend of Surface Active Ionic Liquid and Nonionic Surfactant. Energy Fuels 2019, 33, 541–550. 10.1021/acs.energyfuels.8b03419. [DOI] [Google Scholar]
- Gu Y.; Shi L.; Cheng X.; Lu F.; Zheng L. Aggregation Behavior of 1-Dodecyl-3-methylimidazolium Bromide in Aqueous Solution: Effect of Ionic Liquids with Aromatic Anions. Langmuir 2013, 29, 6213–6220. 10.1021/la400497r. [DOI] [PubMed] [Google Scholar]
- Yuan J.; Bai X.; Zhao M.; Zheng L. C12mimBr Ionic Liquid/SDS Vesicle Formation and Use As Template for the Synthesis of Hollow Silica Spheres. Langmuir 2010, 26, 11726–11731. 10.1021/la101221z. [DOI] [PubMed] [Google Scholar]
- Jiao J.; Dong B.; Zhang H.; Zhao Y.; Wang X.; Wang R.; Yu L. Aggregation Behaviors of Dodecyl Sulfate-Based Anionic Surface Active Ionic Liquids in Water. J. Phys. Chem. B 2012, 116, 958–965. 10.1021/jp209276c. [DOI] [PubMed] [Google Scholar]
- Wang D.; Ou K.; Yang Z.; Lin M.; Dong Z. Thermodynamic insights and molecular environments into catanionic surfactant systems: Influence of chain length and molar ratio. J. Colloid Interface Sci. 2019, 548, 77–87. 10.1016/j.jcis.2019.04.023. [DOI] [PubMed] [Google Scholar]
- Li J.; Fan T.; Xu Y.; Wu X. Ionic liquids as modulators of physicochemical properties and nanostructures of sodium dodecyl sulfate in aqueous solutions and potential application in pesticide microemulsions. Phys. Chem. Chem. Phys. 2016, 18, 29797–29807. 10.1039/c6cp04722j. [DOI] [PubMed] [Google Scholar]
- Smirnova N. A.; Vanin A. A.; Safonova E. A.; Pukinsky I. B.; Anufrikov Y. A.; Makarov A. L. Self-assembly in aqueous solutions of imidazolium ionic liquids and their mixtures with an anionic surfactant. J. Colloid Interface Sci. 2009, 336, 793–802. 10.1016/j.jcis.2009.04.004. [DOI] [PubMed] [Google Scholar]
- Javadian S.; Nasiri F.; Heydari A.; Yousefi A.; Shahir A. A. Modifying Effect of Imidazolium-Based Ionic Liquids on Surface Activity and Self-Assembled Nanostructures of Sodium Dodecyl Sulfate. J. Phys. Chem. B 2014, 118, 4140–4150. 10.1021/jp5010049. [DOI] [PubMed] [Google Scholar]
- Pazo-Llorente R.; Bravo-Díaz C.; González-Romero E. Ion exchange effects on the electrical conductivity of acidified (HCl) sodium dodecyl sulfate solutions. Langmuir 2004, 20, 2962–2965. 10.1021/la035793s. [DOI] [PubMed] [Google Scholar]
- Gaillon L.; Lelièvre J.; Gaboriaud R. Counterion Effects in Aqueous Solutions of Cationic Surfactants: Electromotive Force Measurements and Thermodynamic Model. J. Colloid Interface Sci. 1999, 213, 287–297. 10.1006/jcis.1999.6141. [DOI] [PubMed] [Google Scholar]
- Chaimovich H.; Bonilha J. B. S.; Politi M. J.; Quina F. H. Ion exchange in micellar solutions. 2. Binding of hydroxide ion to positive micelles. J. Phys. Chem. 1979, 83, 1851–1854. 10.1021/j100477a011. [DOI] [Google Scholar]
- Wang H.; Zhang L.; Wang J.; Li Z.; Zhang S. The first evidence for unilamellar vesicle formation of ionic liquids in aqueous solutions. Chem. Commun. 2013, 49, 5222–5224. 10.1039/c3cc41908h. [DOI] [PubMed] [Google Scholar]
- Daful A. G.; Avalos J. B.; Mackie A. D. Model Shape Transitions of Micelles: Spheres to Cylinders and Disks. Langmuir 2012, 28, 3730–3743. 10.1021/la204132c. [DOI] [PubMed] [Google Scholar]
- Vlachy N.; Drechsler M.; Touraud D.; Kunz W. Anion specificity influencing morphology in catanionic surfactant mixtures with an excess of cationic surfactant. C. R. Chim. 2009, 12, 30–37. 10.1016/j.crci.2008.10.010. [DOI] [Google Scholar]
- Chaudhuri A.; Loughlin J. A.; Romsted L. S.; Yao J. Arenediazonium salts: new probes of the interfacial compositions of association colloids. 1. Basic approach, methods, and illustrative applications. J. Am. Chem. Soc. 1993, 115, 8351–8361. 10.1021/ja00071a050. [DOI] [Google Scholar]
- Jiang Y.; Li F.; Luan Y.; Cao W.; Ji X.; Zhao L.; Zhang L.; Li Z. Formation of drug/surfactant catanionic vesicles and their application in sustained drug release. Int. J. Pharm. 2012, 436, 806–814. 10.1016/j.ijpharm.2012.07.053. [DOI] [PubMed] [Google Scholar]
- Wang Y.-J.; Pan M.-H.; Cheng A.-L.; Lin L.-I.; Ho Y.-S.; Hsieh C.-Y.; Lin J.-K. Stability of curcumin in buffer solutions and characterization of its degradation products. J. Pharm. Biomed. Anal. 1997, 15, 1867–1876. 10.1016/s0731-7085(96)02024-9. [DOI] [PubMed] [Google Scholar]
- Bhatia N. K.; Kishor S.; Katyal N.; Gogoi P.; Narang P.; Deep S. Effect of pH and temperature on conformational equilibria and aggregation behaviour of curcumin in aqueous binary mixtures of ethanol. RSC Adv. 2016, 6, 103275–103288. 10.1039/c6ra24256a. [DOI] [Google Scholar]
- Mirzaee F.; Hosseinzadeh L.; Ashrafi-Kooshk M. R.; Esmaeili S.; Ghobadi S.; Farzaei M. H.; Zad-Bari M. R.; Khodarahmi R. Diverse Effects of Different ″Protein-Based″ Vehicles on the Stability and Bioavailability of Curcumin: Spectroscopic Evaluation of the Antioxidant Activity and Cytotoxicity In Vitro. Protein Pept. Lett. 2019, 26, 132–147. 10.2174/0929866525666181114152242. [DOI] [PMC free article] [PubMed] [Google Scholar]
- Kumar A.; Kaur G.; Kansal S. K.; Chaudhary G. R.; Mehta S. K. Enhanced solubilization of curcumin in mixed surfactant vesicles. Food Chem. 2016, 199, 660–666. 10.1016/j.foodchem.2015.12.077. [DOI] [PubMed] [Google Scholar]
- Rather M. A.; Rather G. M.; Pandit S. A.; Bhat S. A.; Bhat M. A. Determination of cmc of imidazolium based surface active ionic liquids through probe-less UV-vis spectrophotometry. Talanta 2015, 131, 55–58. 10.1016/j.talanta.2014.07.046. [DOI] [PubMed] [Google Scholar]
- Geng Y.; Romsted L. S.; Menger F. Specific Ion Pairing and Interfacial Hydration as Controlling Factors in Gemini Micelle Morphology. Chemical Trapping Studies. J. Am. Chem. Soc. 2006, 128, 492–501. 10.1021/ja056807e. [DOI] [PubMed] [Google Scholar]
- Brown K. C.; Doyle M. P. Reduction of arenediazonium salts by hydroquinone. Kinetics and mechanism for the electron-transfer step. J. Org. Chem. 1988, 53, 3255–3261. 10.1021/jo00249a021. [DOI] [Google Scholar]
- Bravo-Diaz C. Diazo ethers: Formation and decomposition in the course of reactions between arenediazonium ions and different alcohols. Mini-Reviews Org. Chem. 2009, 6, 105–113. 10.2174/157019309788167693. [DOI] [Google Scholar]
- Bravo-Díaz D. C.Diazohydroxides, Diazoethers and Related Species. PATAI’S Chemistry of Functional Groups; American Cancer Society, 2010. [Google Scholar]
- Korobov V.; Ochkov V.. Chemical Kinetics with Mathcad and Maple; SpringerWien: NewYork, 2011. [Google Scholar]
- Lakowicz J. R.Principles of Fluorescence Spectroscopy; Springer: New York, 2006. [Google Scholar]
Associated Data
This section collects any data citations, data availability statements, or supplementary materials included in this article.


