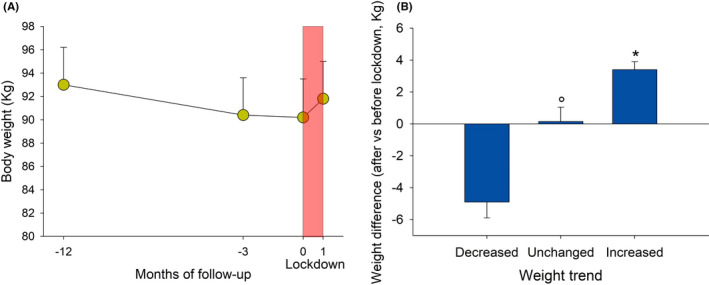
FIGURE 3.

A, Body weight measured 1 y, 3 mo before the lockdown (LD), at the lockdown and 1 mo after the lockdown, in a subgroup of overweight/obese subjects previously enrolled in a monitoring programme for weight loss (NAFLD group). Subjects were adequately trained on beneficial effects of healthy diet and regular physical activity. Bars indicate means, and vertical lines indicate SE. B, Average weight change in subjects reporting decreased, unchanged and increased weight after the lockdown. *P < .05 vs decreased and unchanged weight; °P < .05 vs decreased weight (ANOVA followed by Fisher's LSD Multiple comparison test or chi‐squared test)
