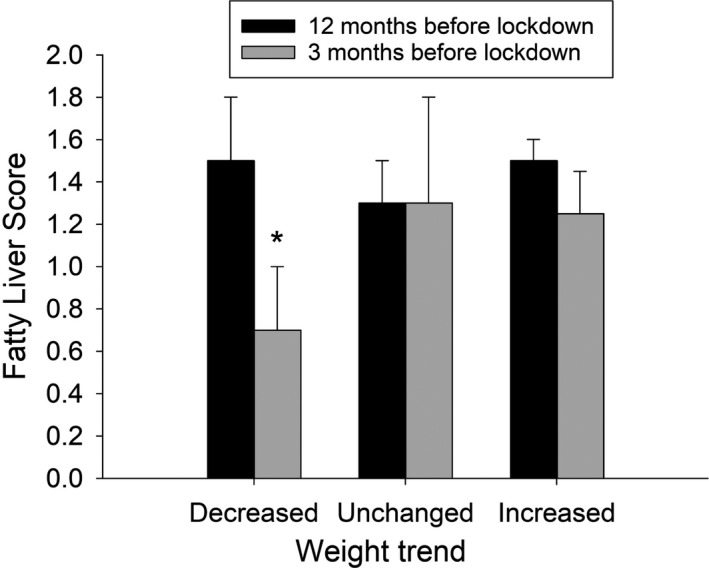
FIGURE 4.

Fatty liver score measured by ultrasonography 12 and 3 mo before the lockdown in a subgroup of overweight/obese subjects enrolled, 1 y before the lockdown, in a monitoring programme for weight loss. Bars indicate means, vertical lines indicate SE. *P < .05, Student's t test for paired data
