
FIGURE 5.
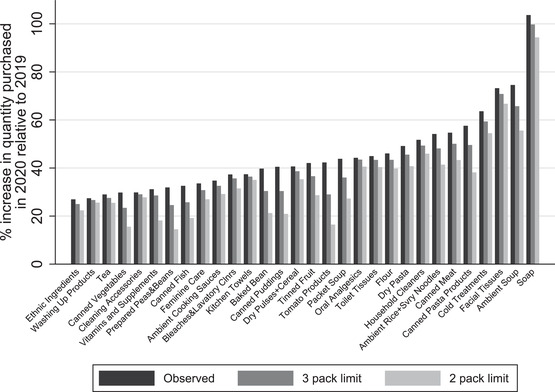
Change in quantity spikes under counterfactual quantity limits
Note: The black bars show the percentage increase in quantity purchased for each category between the four‐week period ending 22 March in 2019 and the same period in 2020. The dark and light grey bars show the analogous, counterfactual increases if households were limited to buying no more than three and no more than two packs per transaction, respectively.