FIGURE 1.

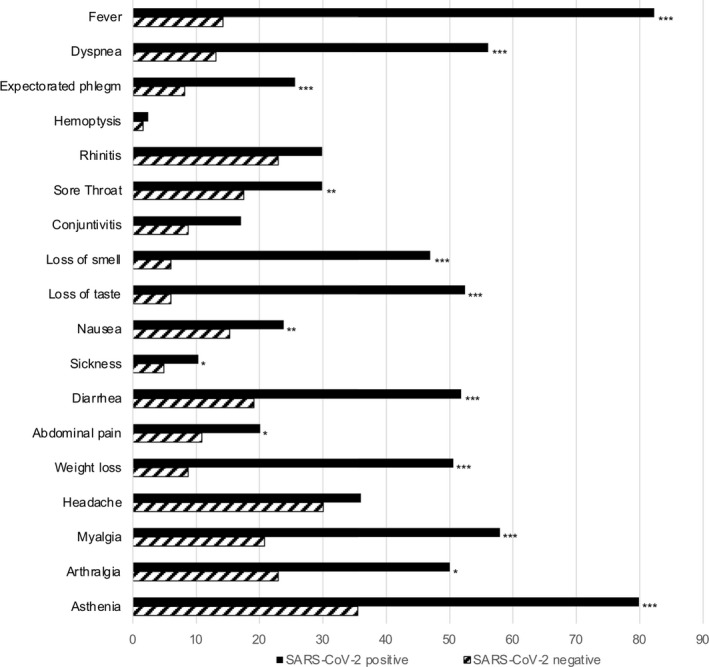
Symptoms and signs during the acute phase of SARS‐CoV‐2 infection and during the same period in SARS‐CoV‐2‐nesgative subjects. Data are expressed as percentage of subjects reporting the condition. *p < 0.05, **p < 0.01, ***p < 0.001

Symptoms and signs during the acute phase of SARS‐CoV‐2 infection and during the same period in SARS‐CoV‐2‐nesgative subjects. Data are expressed as percentage of subjects reporting the condition. *p < 0.05, **p < 0.01, ***p < 0.001