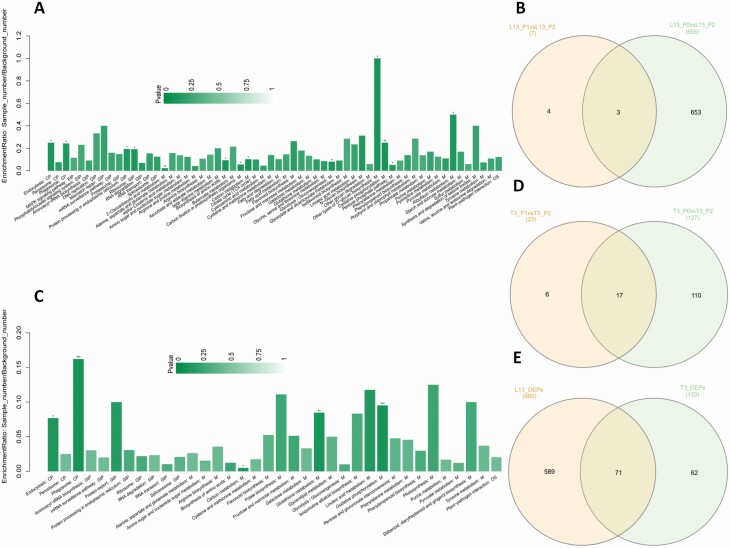
Figure 2.
Analysis of the DEPs. (A) KEGG enrichment analysis of the DEPs between L13_P2 and L13_P0. (B) Venn diagram depicting the shared and unique DEPs between L13_P2 vs. L13_P1 and L13_P2 vs. L13_P0. (C) KEGG enrichment analysis of the DEPs between T3_P2 and T3_P0. (D) Venn diagram depicting the shared and unique DEPs between T3_P2 vs. T3_P1 and T3_P2 vs. T3_P0. (E) Venn diagram depicting the shared and unique DEPs between L13 and T3. *, ** or *** means corresponding KEGG pathways were significantly enriched at P < 0.05, 0.01 or 0.001 respectively.

