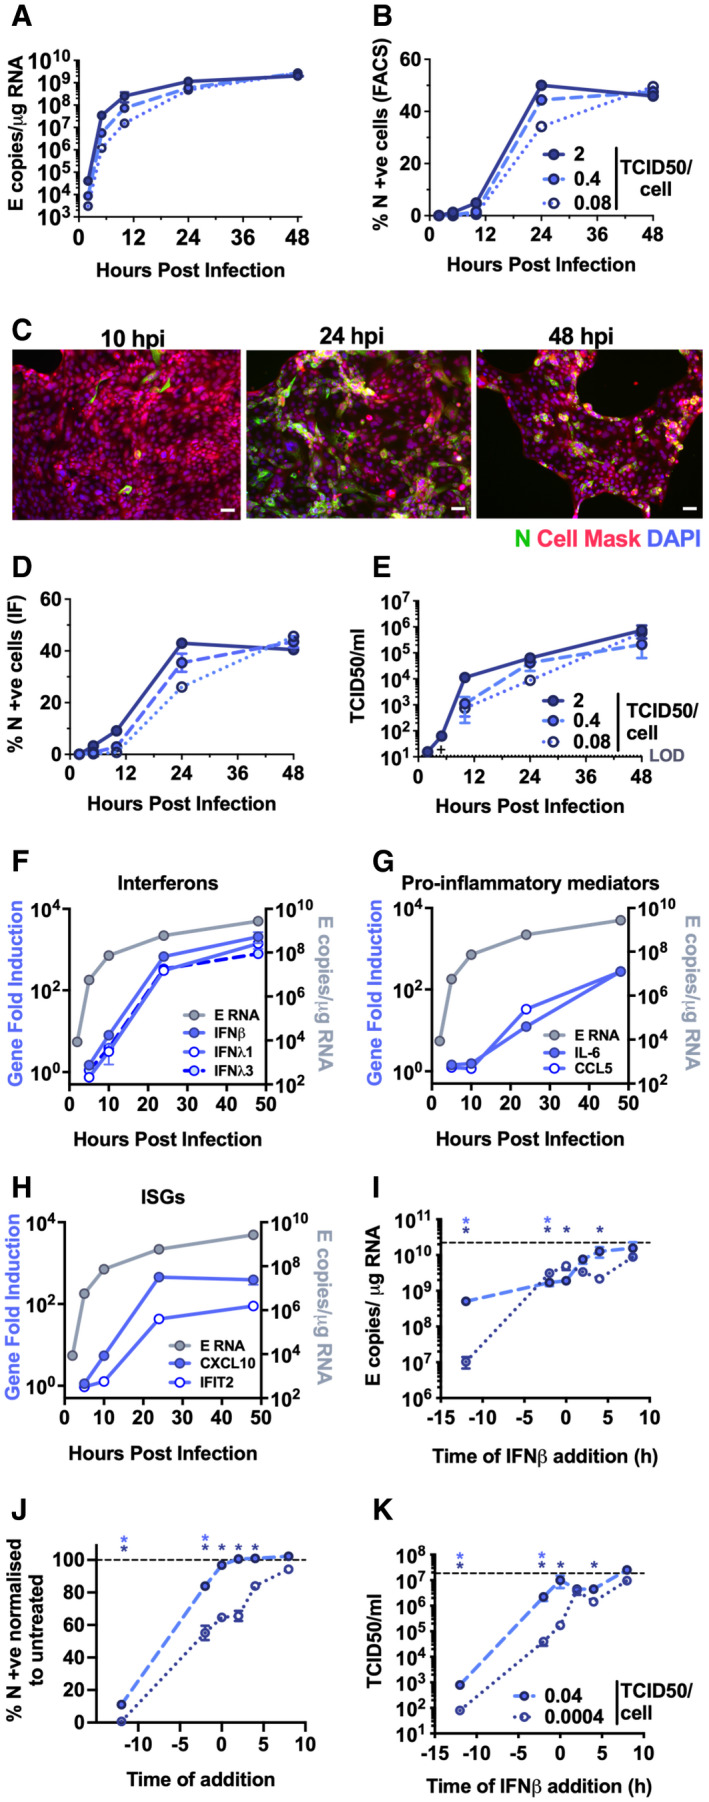
Figure 1. SARS‐CoV‐2 activates delayed innate immune responses in lung epithelial cells.

-
A–HMeasurements of replication and innate immune induction in Calu‐3 lung epithelial cells infected with SARS‐CoV‐2 at MOIs 0.08, 0.4 and 2 TCID50VERO/cell. (A) Replication of SARS‐CoV‐2 genomic and subgenomic E RNAs (qRT–PCR). (B) Quantification of N staining from cells in (A) by flow cytometry. Mean percentage of N positive of all live‐gated cells is shown ± SEM, n = 2. (C) Representative example of immunofluorescence staining of N protein (green) after SARS‐CoV‐2 infection of Calu‐3 at MOI 0.4 TCID50VERO/cell, at time points shown. Nuclei (DAPI, blue), cell mask (red). Scale bar represents 50 µm. (D) Quantification of N staining in cells in (C) by immunofluorescence. (E) Infectious virus released from cells in (A) determined by TCID50 on Vero.E6 cells. (F‐H) Fold induction of (F) interferons (IFNβ, IFNλ1 and IFNλ3) (G) pro‐inflammatory mediators (IL‐6 and CCL5) or (H) IFN‐stimulated genes (CXCL10 and IFIT2) each overlaid with SARS‐CoV‐2 E (qRT‐PCR). All data from cells in (A) at MOI 0.4 TCID50VERO/cell. (A–H) Means from replicate wells shown ± SEM n = 2; full growth curve is representative of three independent experiments.
-
I–KSARS‐CoV‐2 infection (MOIs 0.04 (closed symbols) and 0.0004 (open symbols) TCID50VERO/cell) in Calu‐3 cells with addition of 10 ng/ml IFNβ before or after infection at time points shown, measured by (I) E RNA copies (J) N‐positive cells, (K) released virus (TCID50VERO/cell) all measured at 24 hpi. Dotted line indicates untreated. Mean ± SEM, n = 3, one‐way ANOVA light and dark blue * indicates significance for high and low MOIs, respectively.
