-
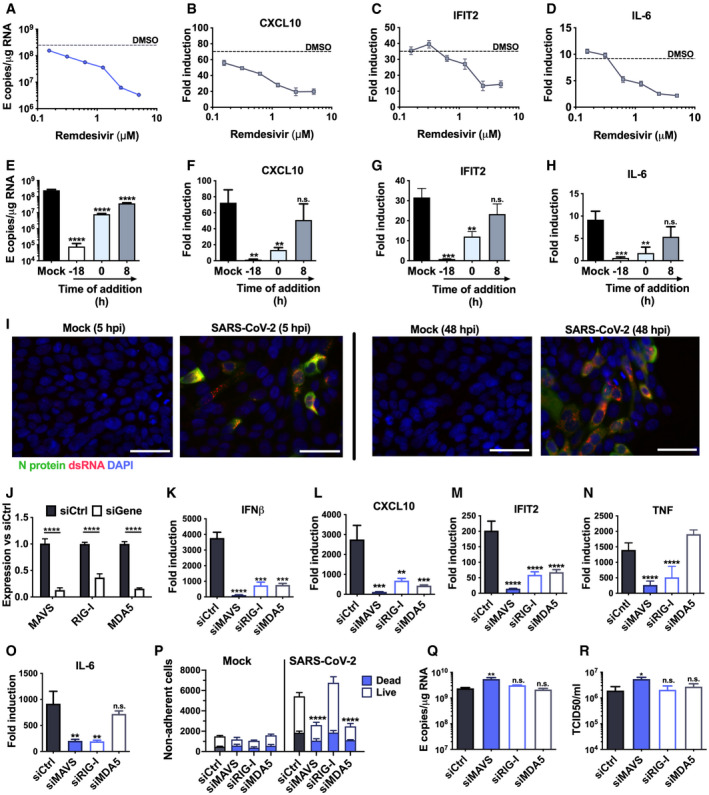
A–D
Measurement of (A) viral genomic and subgenomic E RNA at 24 hpi, (B) fold induction of CXCL10 from (A), (C) IFIT2 and (D) IL‐6 mRNA (qRT‐PCR) from (A) after Remdesivir treatment (0.125–5 μM) of SARS‐CoV‐2‐infected Calu‐3 cells (MOI 0.04 TCID50/cell) with Remdesivir added 2 h prior to infection. Mean ± SEM, n = 3.
-
E–H
Measurement of (E) viral genomic and subgenomic E RNA (F) fold induction of CXCL10, (G) IFIT2 and (H) IL‐6 at 24 hpi, of Calu‐3 cells with SARS‐CoV‐2 (MOI 0.04 TCID50VERO/cell) with Remdesivir treatment (5 μM) prior to, at the time of, or 8 h post‐infection. Mean ± SEM, n = 3, one‐way ANOVA with Dunnett’s multiple comparisons test to compare to untreated infected condition (“mock”), ** (P < 0.01), *** (P < 0.001), **** (P < 0.0001).
-
I
Representative example of immunofluorescence staining of dsRNA (red) and N protein (green) after SARS‐CoV‐2 infection of Calu‐3 at MOI 0.4 TCID50VERO/cell, at time points shown. Nuclei (DAPI, blue). Scale bar represents 50 µm.
-
J
RNAi mediated depletion of MAVS, RIG‐I or MDA5, reduced their expression levels as compared to siControl (siCtrl) Mean ± SEM, n = 3. Two‐way ANOVA with Sidak’s multiple comparisons test, **** (P < 0.0001).
-
K–O
Fold induction of (K) IFNβ, (L) CXCL10, (M) IFIT2 (N) TNF and (O) IL‐6 in SARS‐CoV‐2 infected Calu‐3 cells (MOI 0.04 TCID50/cell) 24 hpi. Mean ± SEM, n = 3, and compared to siCtrl for each gene by one‐way ANOVA with Dunnett’s multiple comparisons test, ** (P < 0.01), *** (P < 0.001), **** (P < 0.0001), n.s. : non‐significant.
-
P
Live/dead stain counts for non‐adherent cells, recovered at 48 hpi from supernatants of SARS‐CoV‐2 infected Calu‐3 cells, depleted for MAVS or RNA sensors, compared to siCtrl. Non‐adherent cell counts were determined by acquisition by flow cytometry for a defined period of time. Mean +/‐SEM, n = 3. Total numbers are compared with siCtrl by unpaired t‐test, *** (P < 0.001).
-
Q–R
Viral E RNA and (R) released infectious virus (TCID50VERO/cell) at 24 hpi of infected Calu‐3 cells depleted for MAVs, RIG‐I or MDA5. Mean ± SEM, n = 3. Each group compared to siCtrl by one‐way ANOVA with Dunnett’s multiple comparisons test, *P > 0.05, ** (P < 0.01), n.s : non‐significant.

