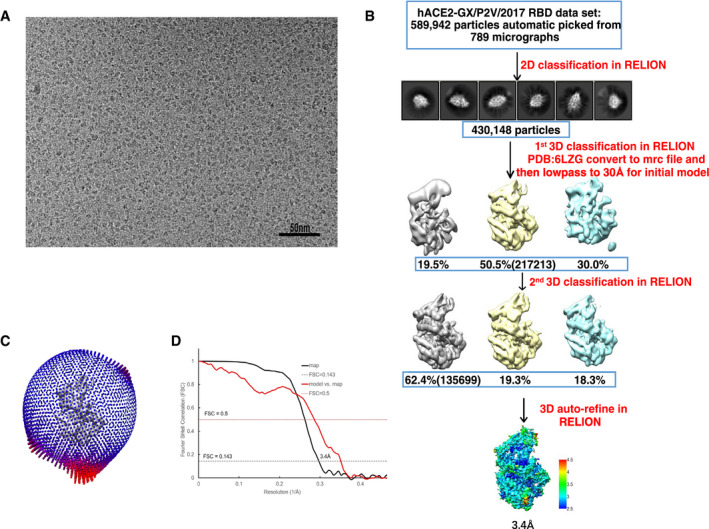
Figure EV3. EM data processing of human ACE2 and GX/P2V/2017 RBD complex.

- One of raw summed micrographs.
- Schematic to show steps in cryo‐EM data processing.
- Angular distribution of the particles for 3D reconstruction.
- Fourier shell correlation (FSC) of final EM map and model vs. map.
