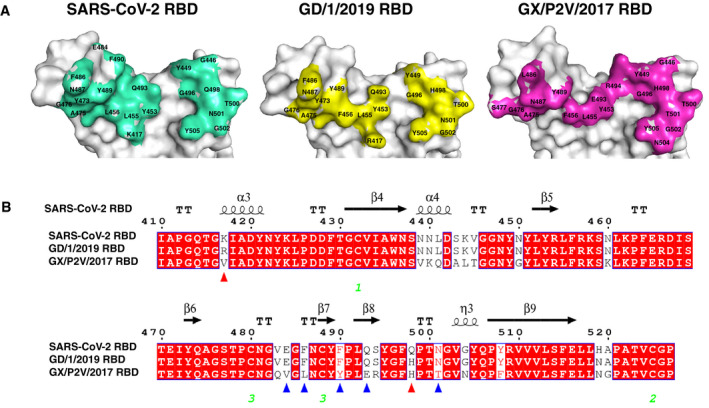
Figure 5. Comparison of SARS‐CoV‐2 RBD, GD/1/2019 RBD, and GX/P2V/2017 RBD binding sites.

- The structures of SARS‐CoV‐2 RBD, GD/1/2019 RBD, and GX/P2V/2017 RBD displayed in surface view. Residues that interact with the hACE2 are marked.
- Sequence alignment of the RBD sequences from the SARS‐CoV‐2, GD/1/2019, and GX/P2V/2017. Red triangles indicate the two residue substitutions at the binding sites of both GD/1/2019 RBD and GX/P2V/2017 RBD. Blue triangles indicate the five other residue substitutions at the binding site of GX/P2V/2017 RBD. Identical residues are highlighted in red background, and similar residues are labeled in red and boxed in blue lines. The green Arabic numerals 1–3 indicate cysteine residues that pair to form disulfide bonds.
