FIGURE 2.

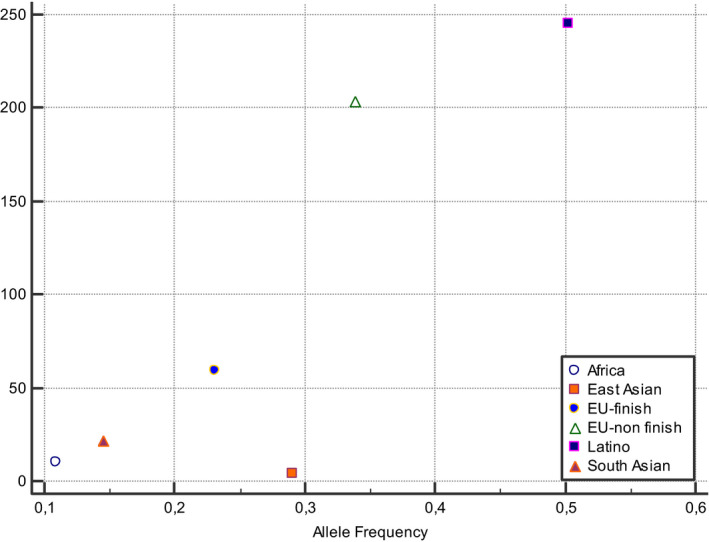
The relationship between allele frequencies of 677C>T and coronavirus deaths/1 M pop was represented graphically by a scatter diagram, stratified by ethnicity

The relationship between allele frequencies of 677C>T and coronavirus deaths/1 M pop was represented graphically by a scatter diagram, stratified by ethnicity