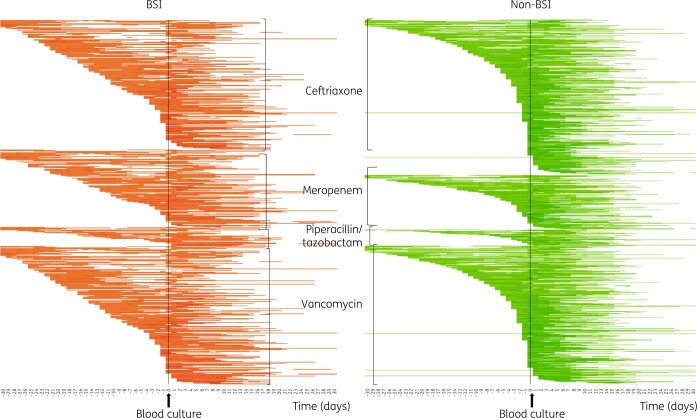
Figure 3.
Heatmap (density array) of days on antibiotics for four selected antibiotics, in patients with and without BSI. Each line represents a patient over time (before and after blood culture collection), with coloured cells depicting days that an individual patient was taking antibiotics. The shading of each square is proportional to the relative intensity of the exposure, with darker shades representing days on multiple antibiotics.

