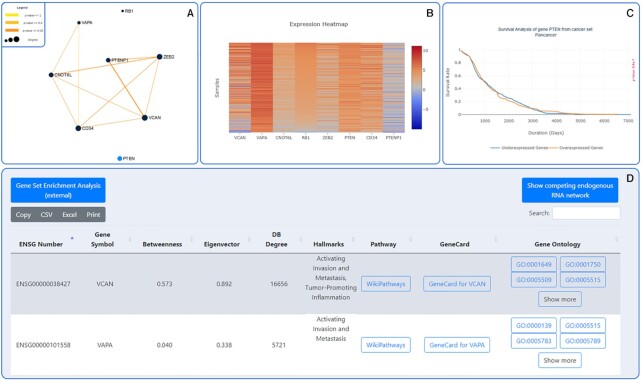
Figure 3.
The reproduced figures of PTEN, PTENP1, VCAN, CD34, CNOT6L, VAPA, ZEB2 and RB1. The SPONGE algorithm found most of the described interactions in the Tay et al. paper and found additional interactions between the genes, which need to be experimentally validated. Additionally, the website provides following information: (A) Network visualizing the interactions between the genes. The edge thickness and color, as well as the node size, corresponds to the P-value/node degree. P-value ≤ 1: yellow, P-value ≤ 0.4: light orange, P-value ≤ 0.05: dark orange. (B) Expression heatmap. (C) Survival Analysis of PTEN. P-value = 5.8e−7. (D) External links of the shown genes for one-click further investigation to important web resources. We included WikiPathways, GeneCards, Quick GO and g:Profiler.

