Figure 6.
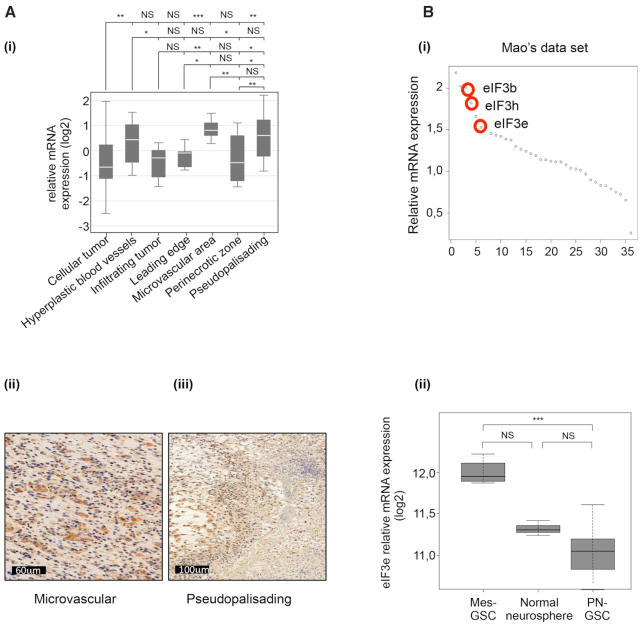
eIF3e expression in different GBM histological regions and in GSCs. (A) Relative mRNA expression for eIF3e in different tumor regions from the Ivy GBM database. Data are presented as mean values ± SEM; *P < 0.05, **P < 0.01, ***P < 0.001, NS: non-significant (Benjamini–Hochberg test) (i). Representative IHC images for eIF3e expression in microvascular proliferating (ii) and pseudopalisading regions (iii). (B) Genome-wide transcriptome microarray analysis (GSE67089) showing that eIF3e was among the most upregulated translation factors in glioma spheres (i). mRNA expression analysis (GSE67089) of eIF3e in the mesenchymal (Mes) and the proneural (PN) subtypes of GSCs compared with normal neurosphere (ii). *P < 0.05 and ***P < 0.001, by one-way ANOVA followed by Dunnett’s post-hoc test. n = 6 for PN, n = 3 for Mes and n = 1 for normal neurosphere.

