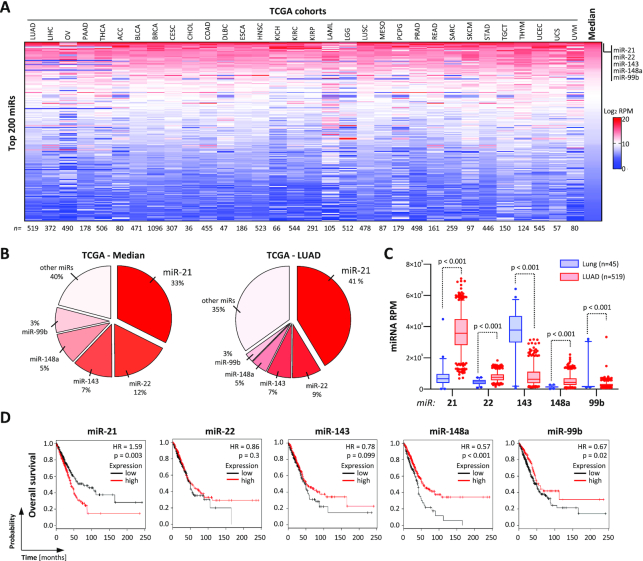
Figure 1.
MiR-21-5p is the most abundant oncomiR across cancer. (A) Heat map showing the expression (log2 RPM) of the 200 most abundant miRNAs in indicated TCGA miRNA-seq data sets. miRNAs are ranked according to the median log2 RPM across all data sets. Numbers of patients in each cohort are indicated in the bottom panel. Sequencing data are summarized in Supplementary Table S1. (B) Pie charts indicating the percentage distribution of miRNAs in all TCGA (left) and LUAD (right) miRNA transcriptomes. (C) Box plots of miRNA expression in lung (blue, n = 45) or LUAD (red, n = 519) data sets. Statistical significance indicated by P-values was determined by the Mann–Whitney test. (D) Kaplan–Meier plots of overall survival analyses based on expression (best cutoff) of indicated miRNAs in LUAD patient samples. HR, hazard ratio; p, log-rank P-value.

