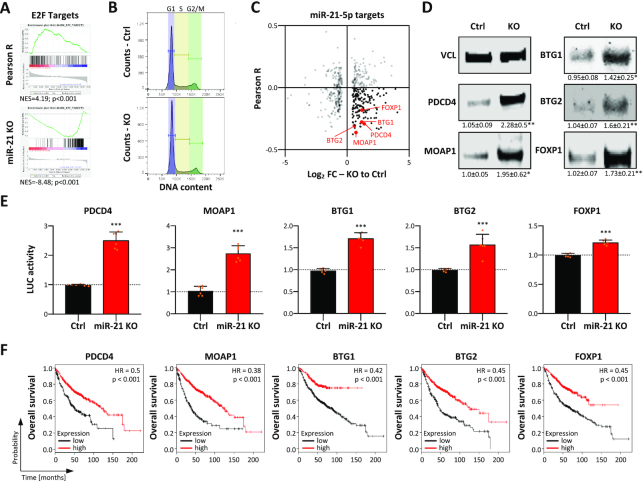
Figure 3.
Loss of miR-21 enforces tumor suppressor expression. (A) E2F_target GSEA of protein-coding genes ranked by the determined Pearson correlation coefficient determined for their associated expression with miR-21 in the LUAD tumor cohort (upper panel). E2F_target GSEA of genes ranked according to their fold change (FC) of expression in MIR21-KO in A549 cells compared to parental cells, as determined by RNA-seq (lower panel). (B) Cell cycle phase distribution of A549 Ctrl and MIR21-KO cells determined by PI labeling and flow cytometry. (C) Scatter plots showing the Pearson correlation of miR-21 expression in LUAD (Pearson R) and differential expression of predicted miR-21 target genes (n = 444) differentially expressed (FDR < 0.01) upon MIR21-KO, as determined in (A). Correlation coefficients were analyzed over 526 LUAD patient samples with matched polyA- and miRNA-seq data sets. MiR-21 target genes were considered when predicted by 5 out of 11 databases analyzed via miRWalk (v2.0). (D) Representative western blot analysis of indicated proteins in parental A549 (Ctrl) and MIR21-KO cells. VCL served as a loading and normalization control. Relative expression values and standard deviation (SD) were determined in three analyses. (E) Luciferase reporter analyses in parental and miR-21 KO A549 cells. The activity of reporters was analyzed by using luciferase reporters comprising 48-nt-long regions of indicated 3′-UTRs including miR-21-5p seed regions. Reporter activities in KO cells were median-normalized to parental cells in six experiments. Statistical significance was determined by Student’s t-test: *P < 0.05; **P < 0.01; ***P < 0.001. (F) Kaplan–Meier plots of overall survival analyses based on expression (best cutoff) of indicated mRNAs in LUAD patient samples. HR, hazard ratio; p, log-rank P-value.

