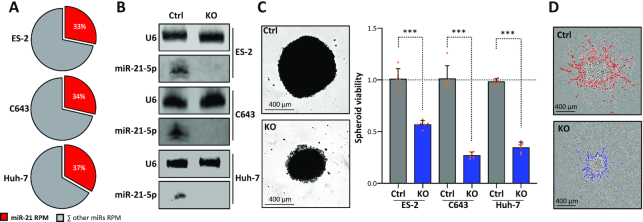
Figure 5.
MIR21-KO concisely reduces proliferation and invasion in distinct cancer-derived cells. (A) Pie charts showing the percentage of miR-21-5p (red) and all other miRNAs in ES-2, C643 and Huh-7 cells, as determined by miRNA-seq. (B) Representative northern blot (n = 3 experiments) of miR-21-5p in parental and MIR21-KO ES-2, C643 and Huh-7 cells. U6 served as a loading control. (C) Proliferation of parental and MIR21-KO ES-2-, C643- and Huh-7-derived spheroids (n = 6 each) was determined by using CellTiter Glo (right). Statistical significance was determined by Student’s t-test: ***P < 0.001. Representative images of ES-2 spheroids are shown (left). (D) Representative bright-field image (n = 3 analyses) of ES-2 spheroid invasion in Matrigel. The invasive front is shown in red (Ctrl, parental) or blue (MIR21-KO).

