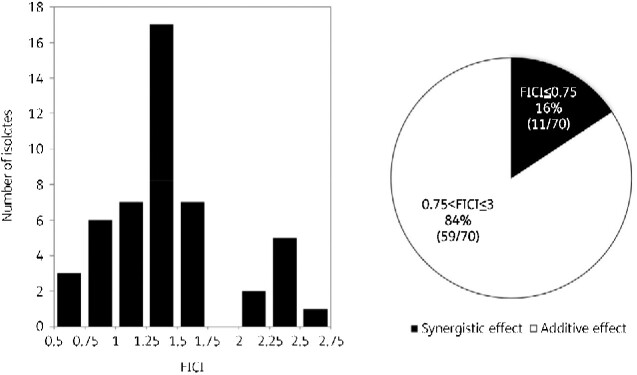
Figure 5.
Distribution of fractional inhibitory concentration index (FICI) values for 48 of the 70 clinical isolates of M. abscessus. In the remaining 22 isolates, either the MIC for sitafloxacin alone was greater than 8 mg/L or a lower MIC than the prepared range was observed, and therefore the FICI could not be calculated. The pie chart shows the percentage of synergistic (black shading) or additive (white shading) effects among the 70 isolates for which the FICI was calculated using the highest estimated MIC.

