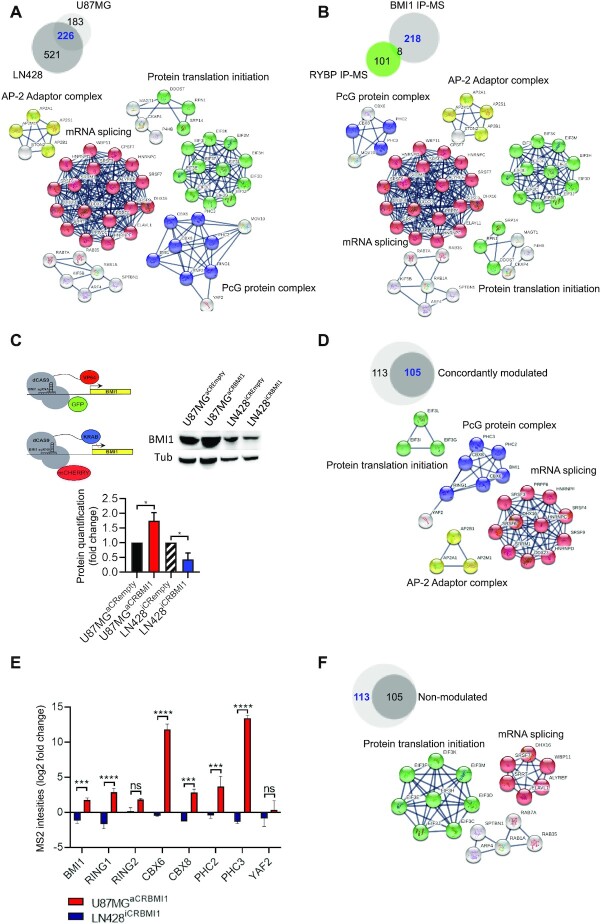
Figure 1.
Characterization of the BMI1 interactome in GBM. (A) Venn diagram indicating BMI1 interactors in GBM cell lines (blue) and protein networks identified from these proteins, including PcG protein complex, protein translation initiation and elongation, mRNA splicing and AP-2 adaptor complex. (B) Venn diagram indicating BMI1 interactors not shared with RYBP (blue) and protein networks identified from these proteins. (C) Schematic illustrating CRISPR/dCAS9 plasmids to modulate BMI1 expression and western blot with quantification demonstrating BMI1 protein modulation (n = 3; one-way ANOVA, *P< 0.05). (D) Venn diagram showing BMI1 bound proteins, which are also concordantly modulated (blue) and their networks. (E) Bar plot showing PRC1 complex members concordantly modulated with BMI1. Fold change indicates different MS2 binding intensities obtained by calculating Log2 fold change of average MS2 spectra values of different replicates of LN428iCRBMI1 and U87MGaCRBMI1 over their matching empty backbones LN428iCRempty and U87MGaCRempty respectively (n = 2; two-way ANOVA, *P< 0.05, **P< 0.01, ***P< 0.001, ****P< 0.0001). (F) Venn diagram showing BMI1 bound proteins, which are not concordantly modulated (blue) and their networks.

