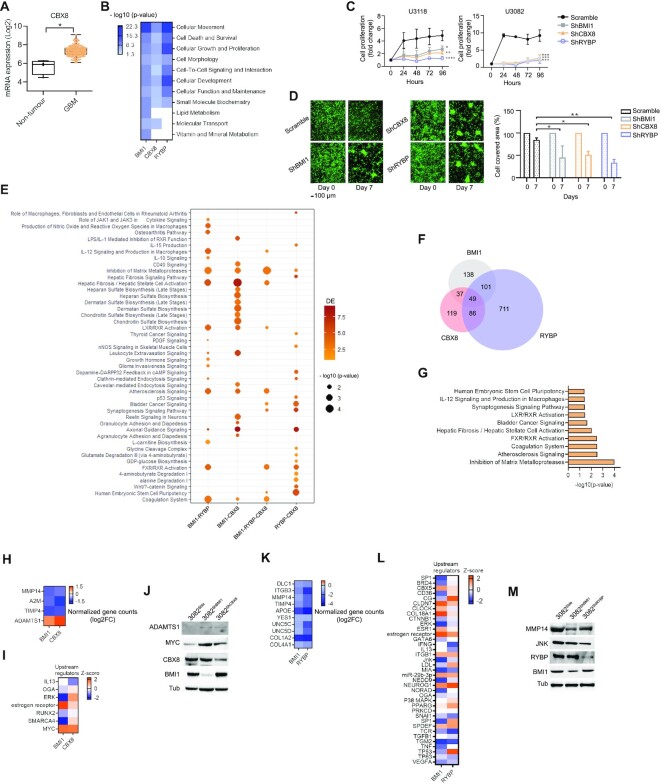
Figure 3.
CBX8 regulates essential tumour properties in GBM. (A) Box plot indicating upregulation of CBX8 in GBM (n = 156) versus non-tumour samples (n = 4) in the TCGA database (Tukey's honest significant differences, *P< 0.05). (B) Enrichment score heatmap showing significantly impacted molecular functions (-log10 of P-value<0.05, P-score = or <1.3), as identified by IPA software, upon silencing of BMI1, CBX8 or RYBP. (C) Growth curve graphs showing decreased cell proliferation when BMI1, CBX8 or RYBP are silenced in two different GIC (U3118 and U3082) (n = 3; two-way ANOVA, *P<0.05, **P<0.01, ***P<0.001, ****P<0.0001). Fold change represents cell proliferation over seeded cells at 24, 48, 72 and 96 h time points. (D) Representative images (left) and quantification (right) of cell aggregation after 7 days upon silencing of BMI1, CBX8 or RYBP (n = 3; two-way ANOVA, *P< 0.05, **P< 0.01, ***P< 0.001, ****P< 0.0001); scale bar: 100 μm. (E) Dot plot of shared enriched canonical pathways dysregulated upon silencing BMI1, CBX8 or RYBP. Colour spectrum represents number of DE and circle size represent P-score values of significance of canonical pathways (P-value<0.05, P-score = or <1.3). (F) Venn diagram showing shared and exclusive DEG within the shBMI1, shCBX8 and shRYBP datasets. (G) Bar plot identifying inhibition of matrix metalloproteinases as the most enriched pathway upon analysis (IPA platform) of common DEG shared between shBMI1, shCBX8 and shRYBP datasets. (H) Log2 Fold change (Log2FC) of normalized gene counts heatmap showing differentially expressed genes belonging to inhibition of matrix metalloproteinase pathway. (I) Enrichment scores heatmap of predicted upstream regulators of the inhibition of matrix metalloproteinase pathway (- log10 of P-value<0.05, P-score = or <1.3), as DEG in shBMI1 and shCBX8 datasets. (J) Western blot for MYC, ADAMTS1 as well as BMI1 and CBX8 with TUBULIN as loading control (n = 2). (K) Log2 Fold change (Log2FC) of normalized gene counts heatmap showing differentially expressed genes belonging to inhibition of matrix metalloproteinase pathway. (L) Enrichment score heatmap of predicted upstream regulators as DEG in shBMI1 and shRYBP datasets (-log10 of P-value<0.05, P-score = or <1.3). (M) Western blot for JNK and MMP14 as well as BMI1 and RYBP are silenced. TUBULIN was used as loading control (n = 2).

