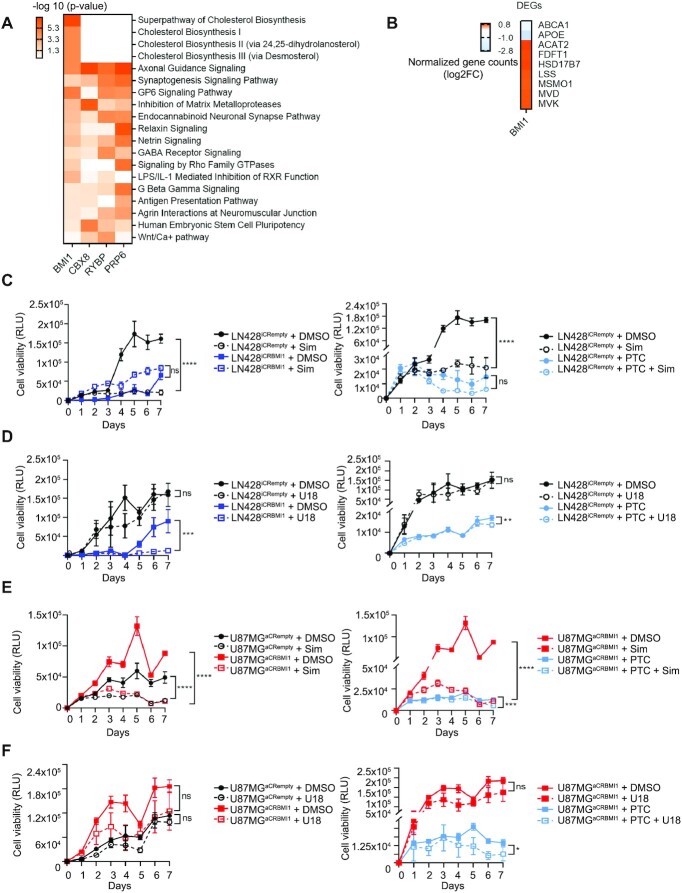
Figure 5.
BMI1 regulates cholesterol metabolism in GBM. (A) Enrichment scores heatmap showing significant dysregulated molecular pathways (IPA software, - log10 of P-value < 0.05, P-score = or <1.3) upon BMI1, CBX8, RYBP or PRP6 silencing. (B) Log2 Fold change (Log2FC) of normalized gene counts heatmap showing differentially expressed genes (DEG) belonging to cholesterol metabolism (production and transport) in the shBMI1 dataset (IPA software, -log10 of P-value < 0.05, P-score = or <1.3). (C) Cell viability assay, assessed as relative luminescence units (RLU), in LN428iCRempty versus LN428iCRBMI1 in the presence of 5 μM DMSO, 80 ng/ml Simvastatin (Sim) or 5 μM PTC 209 (PTC) and in the combination of 80 ng/ml Simvastatin (Sim) and 5 μM PTC 209 (PTC) (n = 3; two-way ANOVA, ns, not significant, *P< 0.05, **P< 0.01, ***P< 0.001, ****P< 0.0001). (D) Cell viability assay, assessed as relative luminescence units (RLU) in LN428iCRempty versus LN428iCRBMI1 in the presence of 5 μM DMSO, 2.5 mM U1866A (U18) or 5 μM PTC 209 (PTC) and in the combination of 2.5 mM U1866A (U18) and 5 μM PTC 209 (PTC) (n = 3, two-way ANOVA, ns, not significant, *P< 0.05, **P< 0.01, ***P< 0.001, ****P< 0.0001). (E) Cell viability assay, as assessed by relative luminescence units (RLU) in LN428aCRempty versus LN428aCRBMI1 in the presence of 5 μM DMSO, 80 ng/ml Simvastatin (Sim) or 5 μM PTC 209 (PTC) and the combination of 80 ng/ml Simvastatin (Sim) and 5 μM PTC 209 (PTC) (n = 3, two-way ANOVA, ns, not significant, *P< 0.05, **P< 0.01, ***P< 0.001, ****P< 0.0001). (F) Cell viability assay (relative luminescence units, RLU) in LN428aCRempty versus LN428aCRBMI1 in the presence of 5 μM DMSO, 2.5 mM U1866A (U18) or 5 μM PTC 209 (PTC) and the combination of 2.5 mM U1866A (U18) and 5 μM PTC 209 (PTC) respectively (n = 3, two-way ANOVA, ns, not significant, *P< 0.05, **P< 0.01, ***P< 0.001, ****P< 0.0001).

