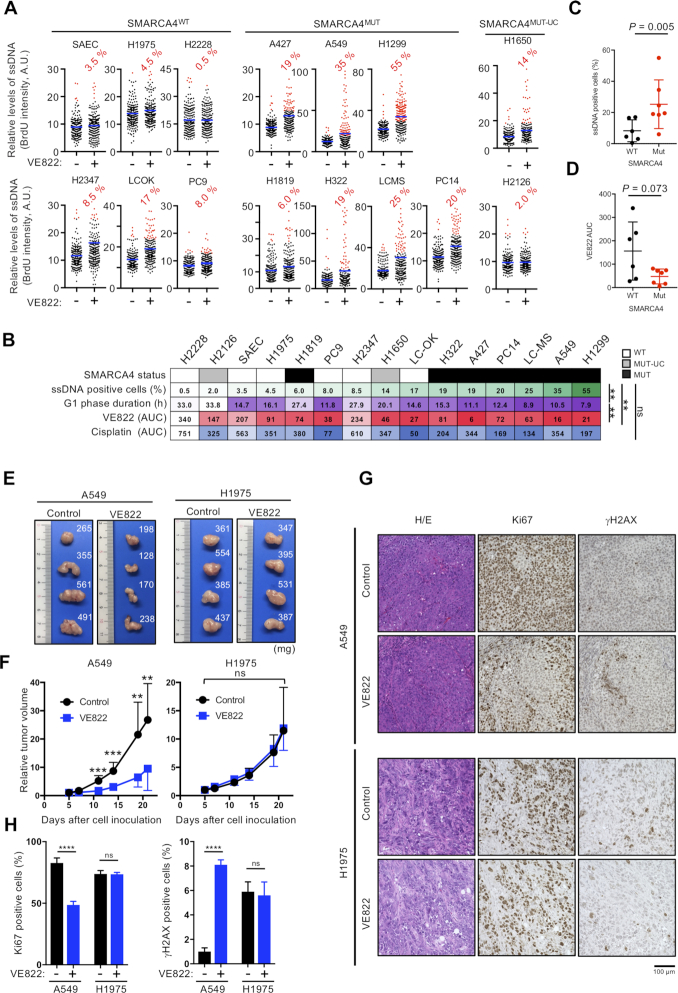
Figure 3.
SMARCA4 status correlates with ATRi efficacy in vitro and in vivo. (A) Quantification of ssDNA intensities of 200 S-phase cells. Blue bars represent the mean intensity. ATRi induction of ssDNA was quantified by setting a threshold for each cell line above 97.5% of DMSO-treated control cells. The ATRi-treated cells that showed ssDNA signals above these thresholds were scored as positive (red dots), and the percentages of ssDNA-positive cells are shown. (B) Order of the percentage of ssDNA-positive cells and G1 phase duration in the assayed cell lines. The AUCs for ATRi and cisplatin are indicated. SMARCA4 status is shown above each. WT, wild type; MUT, deleterious mutation; MUT-UC, uncharacterized mutation. Correlation analyses were performed using Pearson’s coefficient. LADC cells and SAECs were divided into two groups (SMARCA4-WT or -MUT) and the percentages of ssDNA-positive cells (C) and AUCs for ATRi (D) were determined. MUT-UC cells were excluded. (E–H) A549 and H1975 cells were injected into the right flanks of BALB/c nude mice. Five days later, the mice were treated with ATRi or vehicle by oral gavage, as described in the legend to Supplementary Figure S3E. (E) Representative images of dissected tumors. (F) Quantitative analysis of tumor progression after 5 days. Data were normalized to pretreatment tumor mass and expressed as mean ± SD (n = 8 for A549 control, n = 7 for others). (G) Representative images of H&E, Ki-67 and γH2AX staining of tumor sections. Scale bar: 100 μm. (H) Quantification of Ki-67- and γH2AX-positive cells in tumor sections. The results represent the mean ± SD of three independent experiments.

