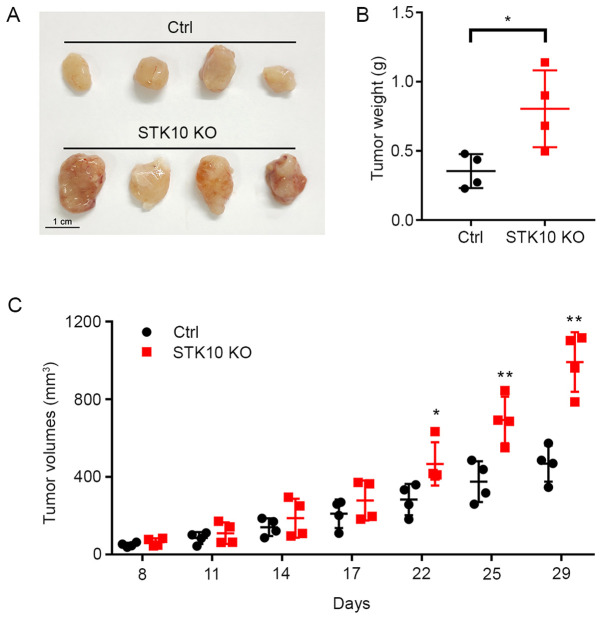
Figure 3.
STK10-KO DU145 cells exhibit increased in vivo tumor growth. (A) Representative xenograft tumors in each group are shown. Scale bar, 1 cm. (B) Tumor weights are shown in the scatter plot. (C) Tumor sizes were measured on the days indicated and the tumor volumes were calculated. Data are presented as the mean ± standard deviation. n=4 per group. *P<0.05, **P<0.01 vs. Ctrl. STK10, serine threonine kinase 10; KO, knockout; Ctrl, control.

