Figure 1.
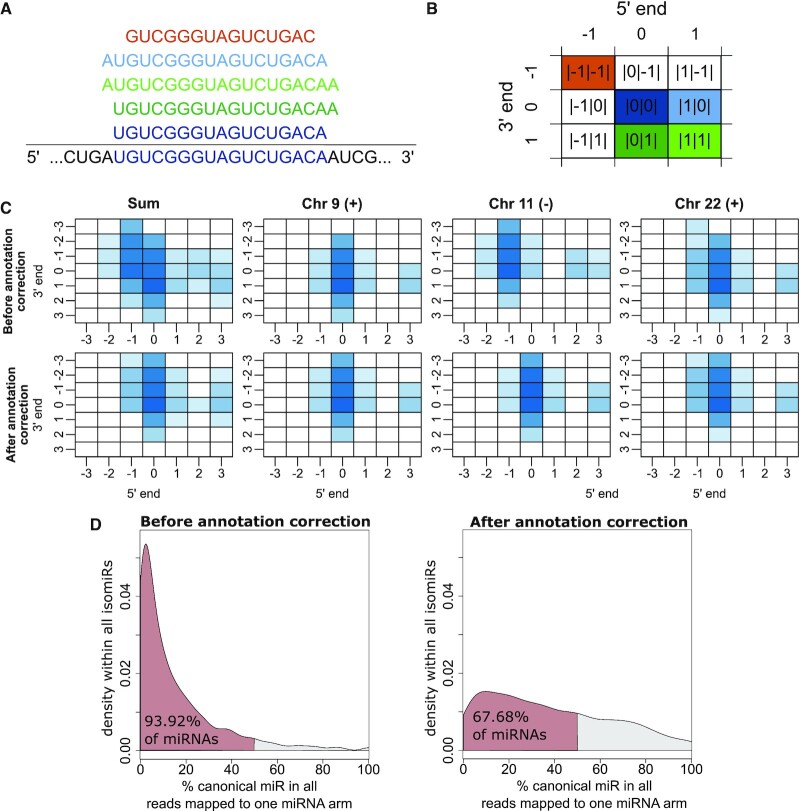
Characterization of the TCGA-LUSC isoform quantification data. (A) Different isomiRs are derived from the pre-miRNA sequence, with varying 3′ and 5′ ends. In this example, the canonical isoform |0|0| (dark blue) and the isoforms |0|1| (dark green), |1|1| (light green), |1|0| (light blue) and |-1|-1| (orange) are depicted. (B) The matrix serves as a representation of isoforms and their respective notation. Color code matches panel (A). (C) Matrix representation of median expression of isoforms derived from the hsa-let-7a-5p stem loop before and after annotation correction of the end position in the TCGA-LUSC data set, colored by log2 median expression. The hsa-let-7a-5p isomiRs are derived from three genetic loci on chromosome 9 (plus strand), 11 (minus strand) and 22 (plus strand). (D) Distribution of canonical isomiRs among all isomiRs for each miRNA arm in percent before (left panel) and after (right panel) annotation correction. Red color marks the area in which canonical isomiRs account for <50% of the reads, i.e. more than 50% of reads coming from this arm are non-canonical.

