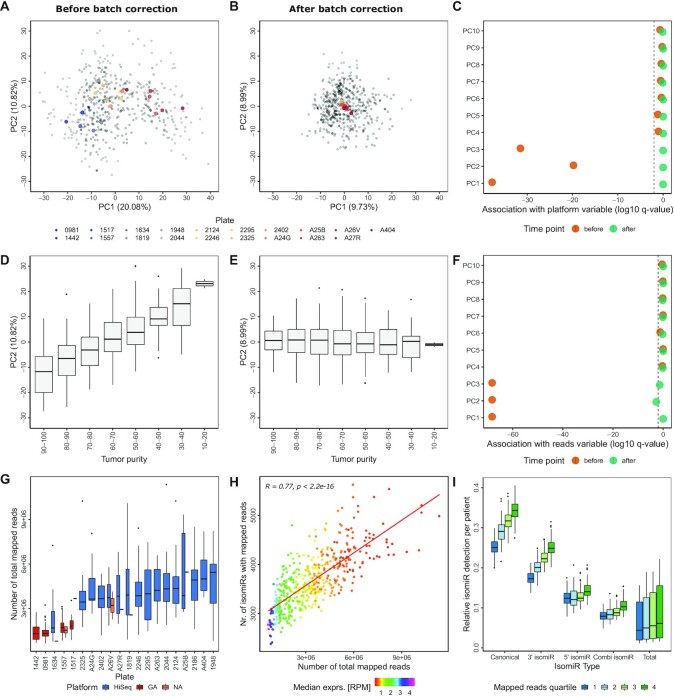
Figure 2.
Batch effects dominate the isoform expression quantification data. (A) PCA plots colored by plate. The mean PC1 and PC2 values were calculated per plate to visualize each centroid in color, actual data points are added in gray. PCA was based on the log2 TCGA-LUSC isoform quantification data before batch correction. The percentage values in parenthesis indicate the variance explained by the corresponding principal component. (B) PCA plots colored by plate as described in (A), after sequential batch correction with plate as first batch variable and purity as second. (C) The association between sequencing platforms and PCs was determined using Wilcoxon Rank Sum tests. Log10 of the resulting q-value is shown before and after batch correction. (D) PC2 of TCGA-LUSC tumor samples with different tumor purity estimates before batch correction, displaying an ordinal association between tumor purity and PC2. Purity estimation of tumor samples was performed using the TCGAbiolinks function TCGAtumor_purity. (E) Box plots of PC2 distribution for TCGA-LUSC samples with differing tumor purity as described in (D) after batch correction. (F) Association between the total number of reads and PC 1–10. Log10 of the q-value of the correlation is shown for each PC. (G) The distribution of sequencing depth (number of total mapped reads) of the TCGA-LUSC isoform expression quantification data per plate, colored by sequencing platform. (H) Spearman correlation between number of isomiRs with non-zero expression and number of mapped reads (sequencing depth) in the TCGA-LUSC cohort. Median expression of the detected isomiRs in RPM is color coded as indicated. (I) Relative isomiR detection per TCGA-LUSC tumor sample for each isomiR type. Canonical isomiRs (|0|0|) as well as 3′ isomiRs (|0|X|), 5′ isomiRs (|X|0|) and mixed isomiRs (|X|Y|) with X and Y unequal 0 and between -3 and 3 were annotated to the provided isoform expression quantification data. In total, 1816 canonical isomiRs from miRBase were detected along with 6759 3′ isomiRs, 3822 5′ isomiRs and 12 916 mixed isomiRs, summing up to 25 313 total isomiRs detected in at least one patient.

