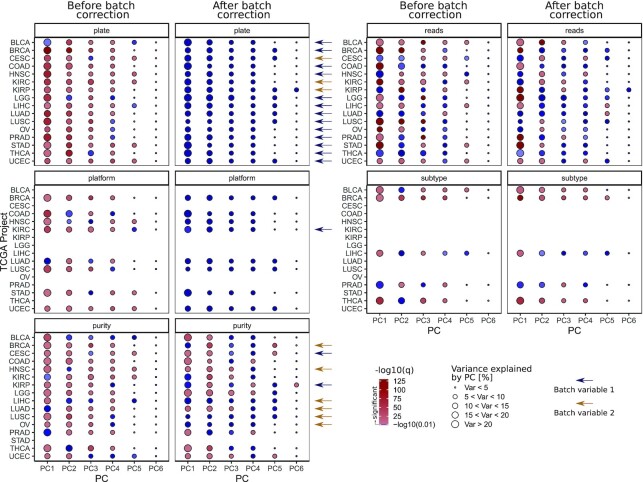
Figure 5.
Association between potentially confounding variables and principal components before and after batch correction in 16 TCGA isomiR expression quantification datasets. PCA was performed using the log2 expression values of isomiRs with a median threshold > 15 RPM. For each variable, association was statistically tested as follows: plate and subtype variable using a Kruskal Wallis test, platform variable using a Wilcoxon Rank Sum test, for the ordinal purity variable a Kendall Tau Rank correlation and for the sequencing depth variable a Spearman correlation. Colors indicate -log10 of the resulting q-values, the red scale represents values above the significance threshold (q-value < 0.01), the blue color scale non-significant q-values. Sizes of the dots indicate the percentage of variance that can be explained by the corresponding PC. Blue arrows indicate the batch variable 1 that was chosen for batch correction for the respective TCGA project in the same row, the yellow arrow the batch variable 2. The BLCA, COAD, KIRC and LGG datasets were batch corrected using the limma algorithm, whereas the other 12 cohorts showed better correction results using ComBat.

