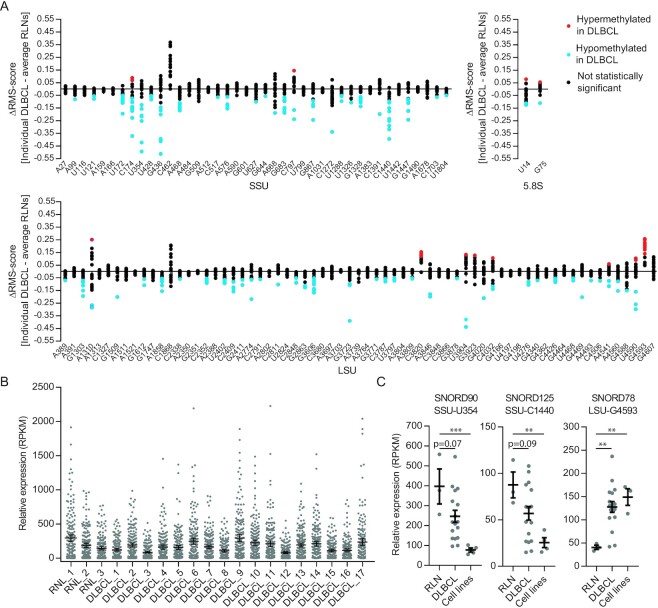
Figure 2.
Profiling of ribose methylations and guide RNAs in patient tumor samples. (A) Summary of RiboMeth-seq analysis depicted deviations from the average of the three RLN control samples. Statistically significant (n = 3) data points are labeled in blue and red, representing hyper- and hypomethylation, respectively. SSU: small ribosomal subunit; LSU: large ribosomal subunit. (B) Normalized expression levels of all rRNA targeting box C/D snoRNAs in DLBCL tumor samples and RLN controls. (C) Expression levels of three box C/D snoRNAs that varied in expression levels in parallel to changes in rRNA methylation levels. Bars represent mean values.

