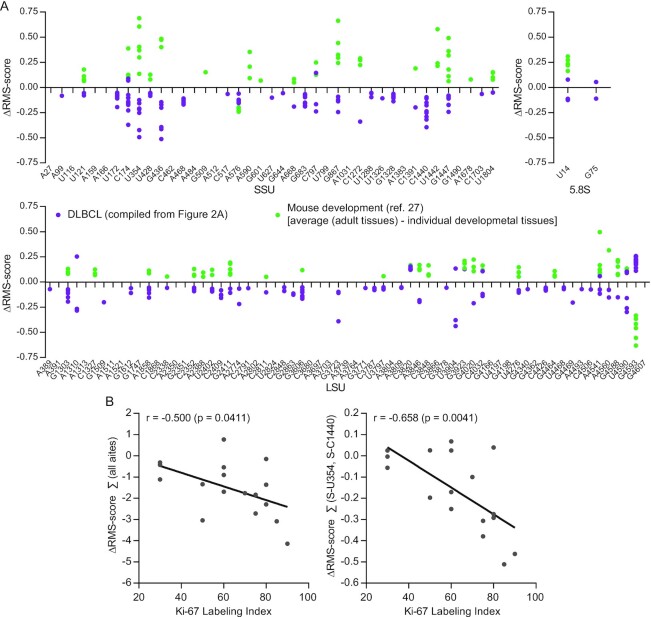
Figure 3.
(A) Comparison of rRNA methylation changes (ΔRMS score) during development and in DLBCL. Purple dots represent statistically significant methylation changes taken from Figure 2A (i.e. combining red and blue dots) and were calculated by subtracting values in RLNs from values obtained from individual DLBCL tumors. Green dots represent statistically significant differences in mouse development from (27) calculated by subtracting values from embryonic tissues from values of the matching adult tissues. (B) Correlation of the sum of ΔRMS scores at all sites (left) or of SSU-U354 and SSU-C1440 only (right) and the Ki-67LI for all patient samples.

