Figure 1.
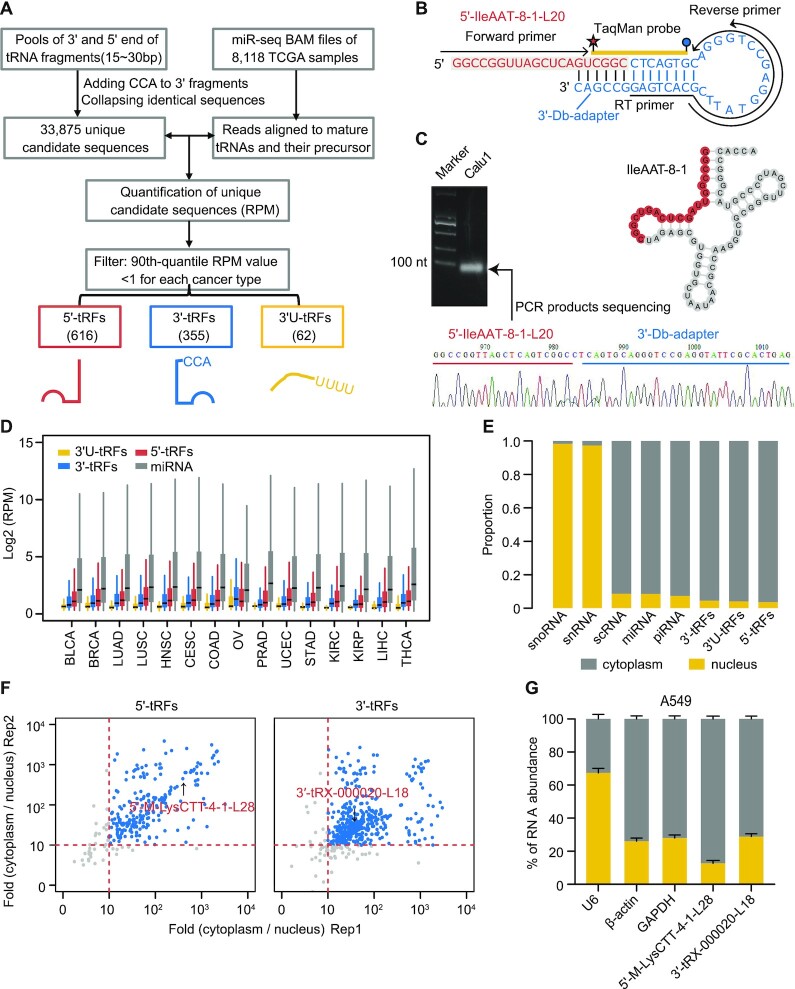
Identification and quantification of endogenous tRFs across 15 cancer types. (A) Schematic illustration of workflow to detect and quantify tRFs. (B, C) Dumbbell polymerase chain reaction (Db-PCR) was used to validate a 20 nt fragment (5′-IleAAT-8-1-L20) from 5′ end of tRNAIleAAT-8-1 that was identified using our computational pipeline. The PCR products were then sequenced. Integrated sequence and structure of Db-PCR adapter (light blue), fragment (dark yellow) and primer (red) are shown in panel (B). (D) Distribution of tRFs and miRNA expression across 15 cancer types. (E) Comparison of the relative abundance of nucleus versus cytoplasm in ENCODE A549 cell lines across different small ncRNA classes. The total reads of each small ncRNA class were normalized by RPM and then their relative abundance between the nuclear and cytoplasmic fractions was calculated. (F) Scatter plot of cytoplasmic over nuclear enrichment for 5′-tRFs (left panel) and 3′-tRFs (right panel) between two replicates in ENCODE A549 cells. (G) Db-PCR analyses of 5′-M-LysCTT-4-1-L28 and 3′-tRX-000020-L18 in the cytoplasm and nucleus of A549 cell lines. The two tRFs showed moderate expression abundance in A549 cells and were randomly selected for independent Db-PCR validation. β-Actin and GAPDH are used as the cytoplasmic control and U6 as the nuclear control. The error bars indicate standard deviation (SD) of three independent experiments. See also Supplementary Figure S1.

