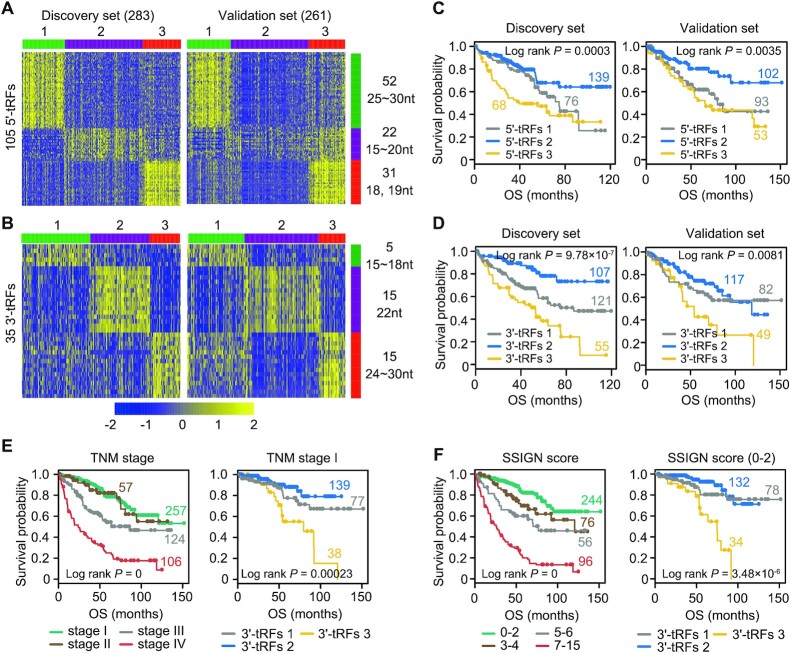
Figure 4.
tRF expression data reveal KIRC subtypes and improve outcome prediction. (A, B) Tumors were clustered into three subtypes according to tRF expression profiles in a discovery set (left panel). Subtype-specific tRF signatures were extracted and then applied to the validation set, yielding similar three separated groups (right panel). The number and length range of representative tRF features are shown on the right side of the figure. The scale bar indicates tRF expression after standardization. Kaplan–Meier survival analysis showing significant prognostic differences among 5′-tRF (C) or 3′-tRF (D) expression subtypes in both discovery (left panel) and validation (right panel) sets. P-value was calculated by a log-rank test. (E) The 3′-tRF expression subtypes could further stratify patients with TNM stage I into groups with distinct prognosis (right panel). Kaplan–Meier plot of the four TNM stages is also shown in the left panel. (F) The 3′-tRF expression subtypes could efficiently separate patients with lower Mayo stage, size, grade and necrosis (SSIGN) score into groups with distinct clinical outcome (right panel). Kaplan–Meier plot of the four SSIGN groups is also shown in the left panel. See also Supplementary Figure S4 and Supplementary Table S4.

