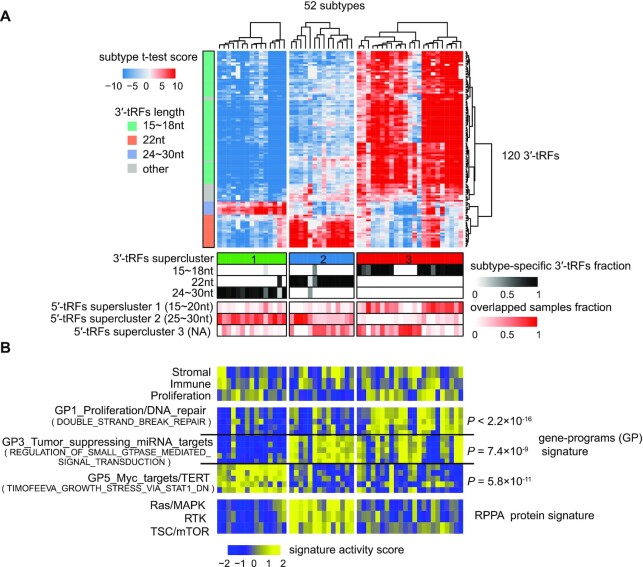
Figure 5.
Identification of biologically distinct supercluster via cluster analysis of 3′-tRF expression subtypes across 15 cancer types. (A) Unsupervised hierarchical clustering of 52 3′-tRF pan-cancer subtypes identified three superclusters highly correlated with the length of 3′-tRFs. Heatmap represented t-test score comparing the 3′-tRF expression level of each 3′-tRF expression subtype with that of other subgroups within the same cancer type. Below the heatmap (top to bottom): group identification numbers of supercluster; the fraction of subtype-specific 3′-tRF signatures belonging to a given group defined by length of 3′-tRFs (see Supplementary Table S5); overlapped fraction between samples of 5′-tRF supercluster and 3′-tRF supercluster. Left side bar shows the length of 3′-tRFs. (B) Biologically distinct characterization among three 3′-tRF superclusters. Heatmap reflected t-test statistic comparing the single-sample gene set enrichment analysis (ssGSEA) score for gene/protein signatures of each 3′-tRF expression subtype with that of other subgroups within the same cancer type. Below the heatmap (top to bottom): the stroma, immune and proliferation signatures (top panel); 3300 bimodal gene signatures (middle panel), grouped into 22 non-redundant gene programs (GPs) symbolizing most cancer hallmarks; RPPA protein signatures (bottom panel). The most correlated GP with each 3′-tRF supercluster was selected according to the enrichment analysis. See also Supplementary Figure S5, Supplementary Table S5 and Supplementary Methods for details on clustering.

