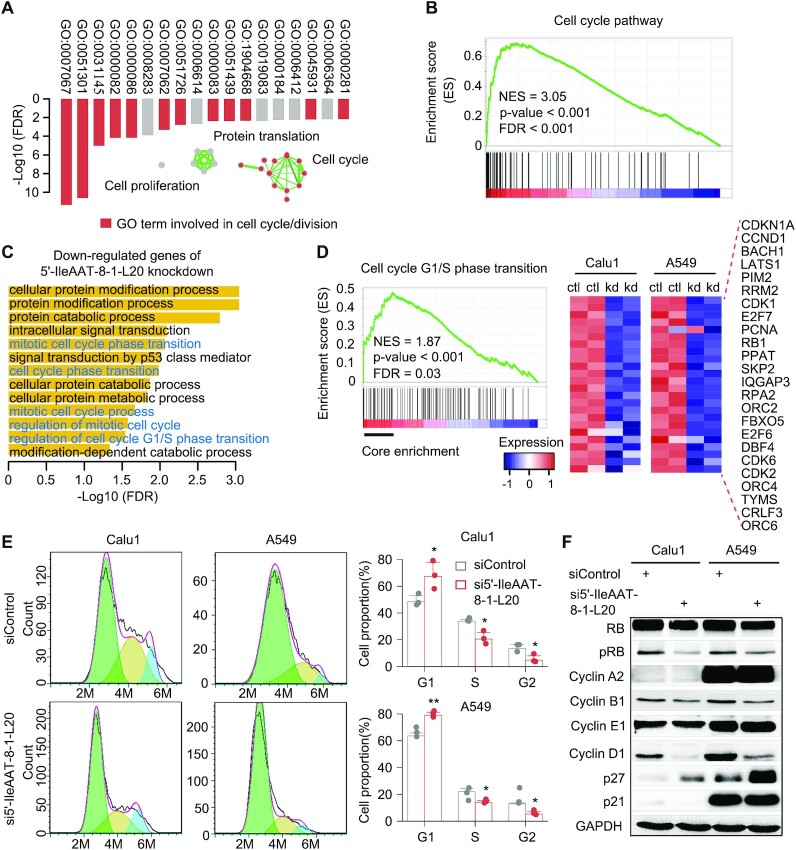
Figure 7.
5′-IleAAT-8-1-L20 regulates the cell cycle in a non-miRNA manner. (A) Gene ontology of protein-coding genes significantly co-expressed with 5′-IleAAT-8-1-L20 in at least eight cancer types in TCGA. (B) Enrichment plot of gene signatures for cell cycle pathway with respect to 5′-IleAAT-8-1-L20 expression level in LUAD. ES, enrichment scores. (C) Gene ontology of genes significantly downregulated by knocking down 5′-IleAAT-8-1-L20 in two lung cancer cell lines, Calu1 and A549. Each cell line has two independent replicates. Cell cycle-associated biological processes are shown in blue color. (D) Enrichment analysis of gene signatures for cell cycle pathway between control and 5′-IleAAT-8-1-L20 knockdown cell lines: Calu1 and A549. The core enrichment genes within cell cycle-related gene sets are marked by black line (left panel) and their abundance in control and 5′-IleAAT-8-1-L20 knockdown cells is presented using a heatmap plot (right panel). The scale bar represents gene expression after standardization. (E) Cell cycle profile of control and 5′-IleAAT-8-1-L20 knockdown cells. *P < 0.05, **P < 0.01 and ***P < 0.001 using a two-sided Student’s t-test. (F) Western blot analysis of cell cycle-related proteins in control and 5′-IleAAT-8-1-L20 knockdown cells. GAPDH protein was used as a control. Light green, light gold and light blue represent G1, S and G2 + M, respectively. See also Supplementary Figure S7.

