Fig. 1.
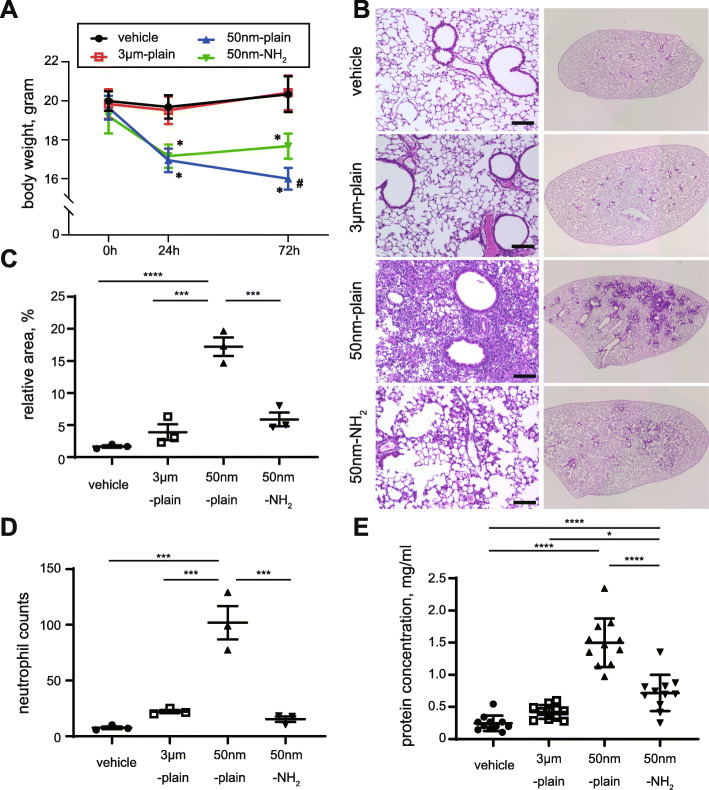
In vivo model of silica-nanoparticle (NP) induced lung injury. A. Body weights of mice at different time points (0 h, 24 h,72 h) after intratracheal instillation of silica or vehicle. Data are expressed as mean ± SD. n = 11–14 per group. *p < 0.0001 versus vehicle or 3 μm group, #p < 0.0001 versus 50 nm-NH2 group, respectively by Tukey’s multiple comparison test. B. Histological changes in lung tissues 72 h after instillation of silica-NPs were observed by hematoxylin and eosin staining. Left panels show low magnification views and right panels show the appearance of whole left lung lobes. Scale bars = 100 μm. C: The lung injury area was quantified by BZ-X Analyzer Hybrid Cell Count Software. An average of three different lobes from each mouse was calculated. Data from at least three mice in each group are shown as mean with 95% CI. p = 0.0055. *p < 0.05, **p < 0.01 by one-way ANOVA with Tukey’s multiple comparison test. D. Quantitative evaluation of neutrophilic inflammation. Three high power field images including terminal bronchioles of each lung lobe stained with H&E were captured. Infiltrated neutrophils found in each picture were counted and the average number of neutrophils was calculated per mice. Data were summarized as mean ± SEM of three mice. ***p < 0.001, ****p < 0.0001 One-way ANOVA with Tukey’s multiple comparison test. E. Total protein concentration in bronchial lavage fluid was assessed by BCA assay. Data are expressed as the mean ± SD. n = 11 per group. One-way ANOVA p < 0.0001. *p < 0.05, ***p < 0.001, ****p < 0.0001 by Tukey’s multiple comparison test

