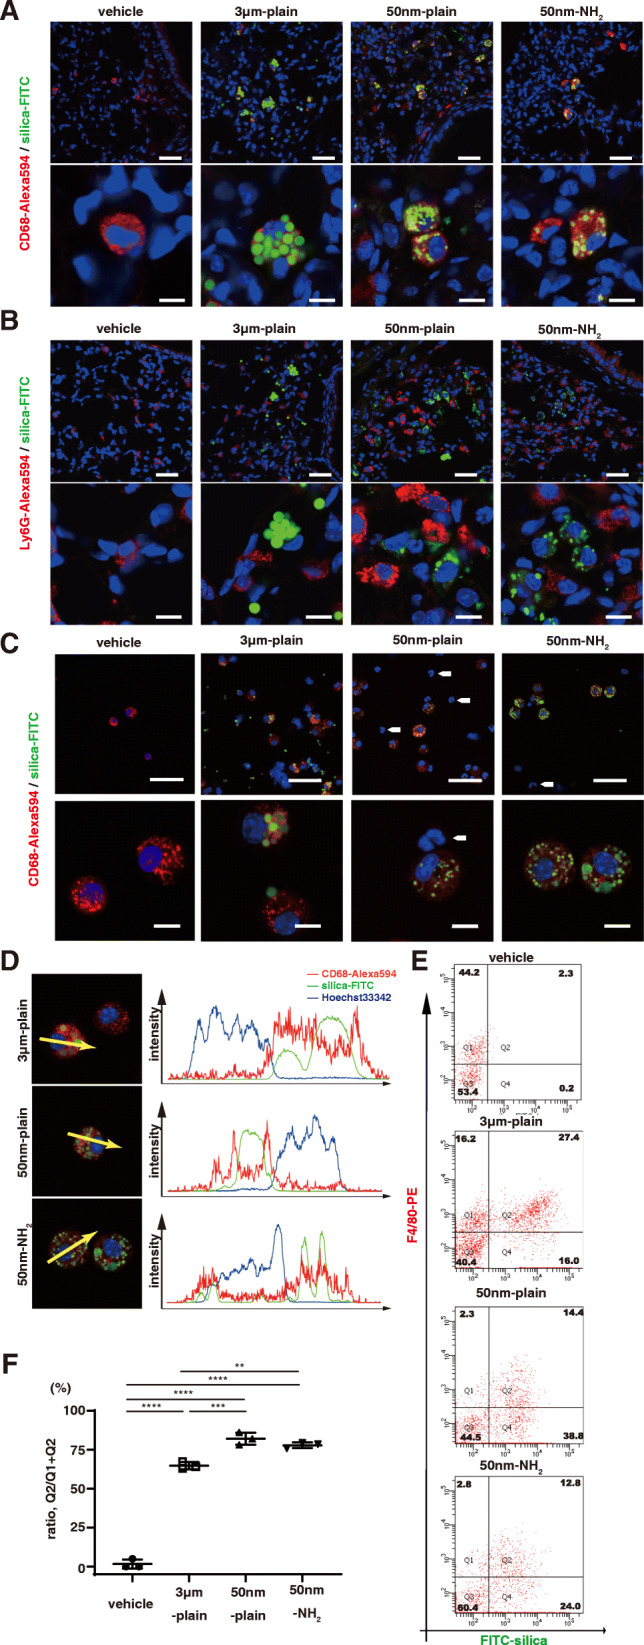
Fig. 3.

Silica-NPs accumulated in alveolar macrophages of silica-NPs instilled murine lungs. A-B. Distribution of silica particles in murine lungs was studied by confocal fluorescence microscopy. A. Representative images showing the localization of silica-NPs and macrophages labeled with anti-CD68 antibody. In the images, blue indicates cell nucleus, green indicates FITC-labeled silica particles, and red indicates Alexa 594 labeled CD68. Scale bars in low magnification (top panels) = 50 μm, in high magnification (bottom panels) = 10 μm. B. Representative images showing the localization of silica-NPs and neutrophils labeled with anti-Ly-6G antibody. In the images, blue indicates cell nucleus, green indicates FITC- labeled silica particles, and red indicates Alexa 594 labeled Ly6G. The white arrows indicate Ly-6G-postive cells with multi-segmented nucleus, which are absent from FITC-labeled silica-NPs. Scale bars in low magnification (top panels) = 50 μm, in high magnification (bottom panels) = 10 μm. C-D. Distribution of silica particles in cells in BALF were studied by confocal fluorescence microscopy. C. Representative images showing the localization of silica-NPs and macrophages labeled with anti-CD68 antibody. In the images, blue indicates cell nucleus, green indicates FITC-labeled silica particles, and red indicates Alexa 594-labeled CD68. Note that the CD68-negative, smaller cells with multi-segmented nucleus indicated by white arrows, are absent from FITC-labelled silica-NPs. D. Plots of the fluorescence intensity of CD68 (red), FITC-labelled silica-NPs (green), and nucleus (blue) over a cross-section along the indicated yellow arrows. Data are representative of at least three independent experiments. E-F. Flow cytometric detection of intracellular silica-NP accumulation in cells retrieved from bronchoalveolar lavage. BAL cells from three animals were pooled in each experiment. E. Representative histograms. F. The ratio of FITC-positive cells in F4/80-positive macrophages. Data are shown as mean ± SD of three independent experiments. **p < 0.01, and ***p < 0.001 by ANOVA with Tukey’s multiple comparison tests
