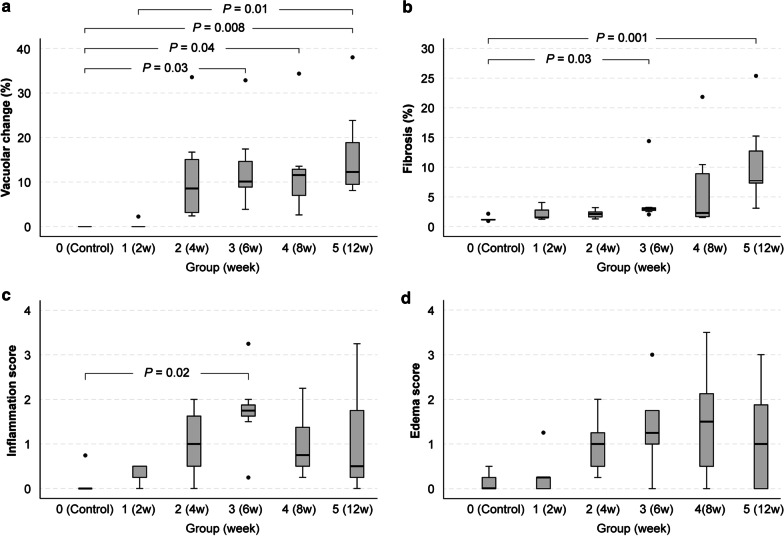
Fig. 3.
Histopathological data for all subjects. The degree of myocardial injury (vacuolar change, a), fibrosis (b), score of myocardial inflammation (c), scores of interstitial edema (d) in controls (group 0), and groups 1–5. Groups 1–5 indicate 2-week, 4-week, 6-week, 8-week, and 12-week treated subjects. Group 1 (2 week), 2 (4 week), 3 (6 week), 4 (8 week), and 5 (12 week) indicate subjects undergoing 2, 4, 6, 8, and 12 weeks of treatment. a The mean vacuolar changes (range) in groups 1–5 were 0.5% (0–2.3%), 11.2% (2.4–33.6%), 13.4% (3.9–32.9%), 12.7% (2.6–35.0%) and 16.5% (8.1–38.0%), respectively. The mean values of vacuolar change were significantly higher in group 3 (P = 0.03), group 4 (P = 0.04), and group 5 subjects (P = 0.008) than in the control subjects (0%, 0–0%). The mean value of group 5 was also significantly higher than group 1 (P = 0.01). b The mean fibrosis (range) in groups 1–5 was 2.2% (1.3–4.1%), 2.1% (1.3–3.2%), 4.5% (2.1–14.4%), 6.7% (1.5–21.8%) and 11. 0% (3.1–25.4%), respectively. The mean values of fibrosis were significantly higher in groups 3 (P = 0.03) and 5 (P = 0.001) than in the control rats (1.2%, 1.0–1.6%). c The median scores of inflammation (range) of groups 1–5 were 0.25 (0–0.50), 1.00 (0–2.00), 1.75 (0.25–3.25), 0.75 (0.25–2.25), and 0.50 (0–3.25), respectively. There was a significant difference only between group 3 and control subjects (P = 0.02). d The median scores of edema (range) of groups 1–5 were 0.25 (0–1.25), 1.00 (0.25–2.00), 1.25 (0–3.00), 1.5 (0–3.50), and 1.00 (0–3.00), respectively. There was no significant difference between groups

